
Page 271 - Biofuels for a More Sustainable Future
P. 271
242 Biofuels for a More Sustainable Future
1
0.9
0.8
Biodiesel price (US$/lit) 0.6
0.7
0.5
0.4
0.3
0.2
0.1
0
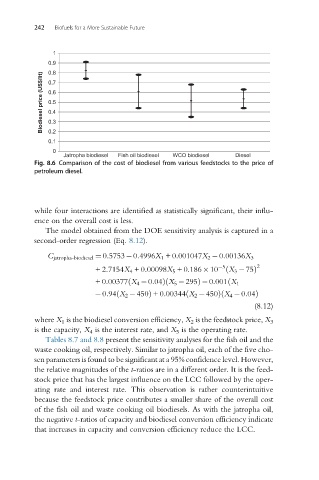
Jatropha biodiesel Fish oil biodiesel WCO biodiesel Diesel
Fig. 8.6 Comparison of the cost of biodiesel from various feedstocks to the price of
petroleum diesel.
while four interactions are identified as statistically significant, their influ-
ence on the overall cost is less.
The model obtained from the DOE sensitivity analysis is captured in a
second-order regression (Eq. 8.12).
C jatropha-biodiesel ¼ 0:5753 0:4996X 1 +0:001047X 2 0:00136X 3
5 2
+2:7154X 4 +0:00098X 5 +0:186 10 ð X 3 75Þ
ð
ð
+0:00377 X 4 0:04Þ X 5 295Þ 0:001ðX 1
ð
0:94 X 2 450Þ +0:00344 X 2 450Þ X 4 0:04Þ
ð
ð
(8.12)
where X 1 is the biodiesel conversion efficiency, X 2 is the feedstock price, X 3
is the capacity, X 4 is the interest rate, and X 5 is the operating rate.
Tables 8.7 and 8.8 present the sensitivity analyses for the fish oil and the
waste cooking oil, respectively. Similar to jatropha oil, each of the five cho-
sen parameters is found to be significant at a 95% confidence level. However,
the relative magnitudes of the t-ratios are in a different order. It is the feed-
stock price that has the largest influence on the LCC followed by the oper-
ating rate and interest rate. This observation is rather counterintuitive
because the feedstock price contributes a smaller share of the overall cost
of the fish oil and waste cooking oil biodiesels. As with the jatropha oil,
the negative t-ratios of capacity and biodiesel conversion efficiency indicate
that increases in capacity and conversion efficiency reduce the LCC.