
Page 273 - Biofuels for a More Sustainable Future
P. 273
Life-cycle costing: Analysis of biofuel production systems 243
cost Continued
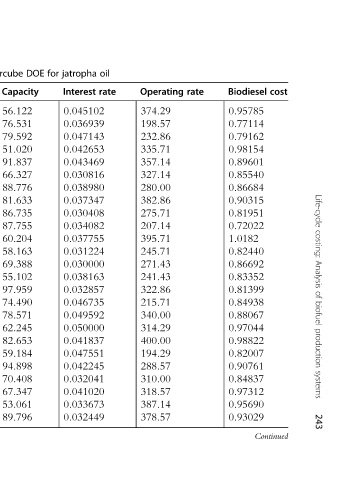
Biodiesel 0.95785 0.77114 0.79162 0.98154 0.89601 0.85540 0.86684 0.90315 0.81951 0.72022 1.0182 0.82440 0.86692 0.83352 0.81399 0.84938 0.88067 0.97044 0.98822 0.82007 0.90761 0.84837 0.97312 0.95690 0.93029
rate
Operating 374.29 198.57 232.86 335.71 357.14 327.14 280.00 382.86 275.71 207.14 395.71 245.71 271.43 241.43 322.86 215.71 340.00 314.29 400.00 194.29 288.57 310.00 318.57 387.14 378.57
oil rate
jatropha Interest 0.045102 0.036939 0.047143 0.042653 0.043469 0.030816 0.038980 0.037347 0.030408 0.034082 0.037755 0.031224 0.030000 0.038163 0.032857 0.046735 0.049592 0.050000 0.041837 0.047551 0.042245 0.032041 0.041020 0.033673 0.032449
for
DOE Capacity
hypercube 56.122 76.531 79.592 51.020 91.837 66.327 88.776 81.633 86.735 87.755 60.204 58.163 69.388 55.102 97.959 74.490 78.571 62.245 82.653 59.184 94.898 70.408 67.347 53.061 89.796
Latin price
the
by Feedstock 412.24 469.39 432.65 455.10 438.78 410.20 457.14 416.33 451.02 422.45 481.63 442.86 491.84 418.37 424.49 489.80 402.04 477.55 459.18 436.73 497.96 440.82 500.00 430.61 475.51
provided
values efficiency
factor
of conversion
Combinations Biodiesel 0.93918 0.97510 0.96857 0.91796 0.97837 0.92939 0.90327 0.95061 0.93429 0.96204 0.94408 0.93592 0.95224 0.90490 0.98000 0.94898 0.95714 0.93755 0.92776 0.90653 0.93102 0.97020 0.91959 0.95388 0.96367
8.3
Table Run 1 2 3 4 5 6 7 8 9 10 11 12 13 14 15 16 17 18 19 20 21 22 23 24 25