
Page 277 - Biofuels for a More Sustainable Future
P. 277
Life-cycle costing: Analysis of biofuel production systems 245
cost Continued
Biodiesel 0.67538 0.63003 0.56900 0.87145 0.53489 0.74336 0.80832 0.71876 0.52854 0.57607 0.44945 0.79126 0.66685 0.55429 0.70625 0.60045 0.50312 0.69632 0.54275 0.62587 0.60132 0.49596 0.55923 0.75709
rate
Operating 288.57 335.71 245.71 378.57 271.43 224.29 314.29 292.86 267.14 190.00 241.43 348.57 301.43 280.00 297.14 352.86 284.29 250.00 254.29 331.43 194.29 207.14 322.86 262.86
rate
oil Interest 0.047959 0.039796 0.030816 0.047143 0.040612 0.045510 0.046327 0.039388 0.041020 0.044286 0.038571 0.040204 0.038980 0.032449 0.050000 0.048367 0.048776 0.045102 0.030000 0.032857 0.038163 0.049184 0.030408 0.035306
fish
for
DOE Capacity
hypercube 77.551 100.00 91.837 57.143 87.755 76.531 81.633 89.796 63.265 62.245 83.673 94.898 74.490 95.918 69.388 86.735 80.612 50.000 70.408 96.939 73.469 64.286 60.204 82.653
Latin price
the
by Feedstock 265.31 204.08 240.82 332.65 167.35 369.39 363.27 308.16 124.49 234.69 106.12 351.02 246.94 185.71 253.06 136.73 100.00 277.55 179.59 222.45 295.92 148.98 118.37 393.88
provided
values efficiency
factor
of conversion
Combinations Biodiesel 0.97673 0.94571 0.95388 0.96367 0.97510 0.90653 0.94082 0.90163 0.90980 0.91959 0.93755 0.96857 0.93429 0.91306 0.90816 0.96204 0.92776 0.97020 0.93265 0.98000 0.97184 0.96041 0.96531 0.95224
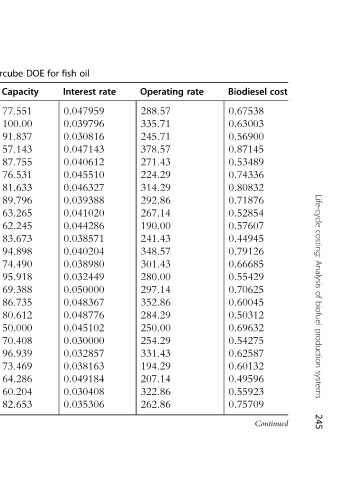
8.4
Table Run 1 2 3 4 5 6 7 8 9 10 11 12 13 14 15 16 17 18 19 20 21 22 23 24