
Page 279 - Biofuels for a More Sustainable Future
P. 279
246 Biofuels for a More Sustainable Future
cost
Biodiesel 0.86909 0.72821 0.74696 0.71060 0.82078 0.62772 0.86090 0.72589 0.57673 0.62526 0.75922 0.50567 0.75371 0.79816 0.64099 0.68188 0.59473 0.79854 0.63654 0.76779 0.63074 0.60747 0.49812 0.82206 0.68419 0.69767
rate
Operating 357.14 215.71 340.00 391.43 395.71 382.86 374.29 370.00 228.57 365.71 237.14 232.86 318.57 275.71 202.86 344.29 305.71 258.57 220.00 327.14 387.14 198.57 211.43 400.00 361.43 310.00
oil—cont’d rate
fish Interest 0.032041 0.046735 0.034082 0.042245 0.041837 0.043061 0.042653 0.044694 0.047551 0.031224 0.034898 0.043469 0.036122 0.045918 0.033265 0.049592 0.043878 0.037347 0.041429 0.031633 0.036939 0.036531 0.037755 0.033673 0.034490 0.035714
for
DOE Capacity
hypercube 66.327 72.449 51.020 68.367 92.857 79.592 67.347 55.102 85.714 84.694 65.306 90.816 52.041 54.082 53.061 93.878 58.163 56.122 98.980 97.959 59.184 88.776 61.224 78.571 75.510 71.429
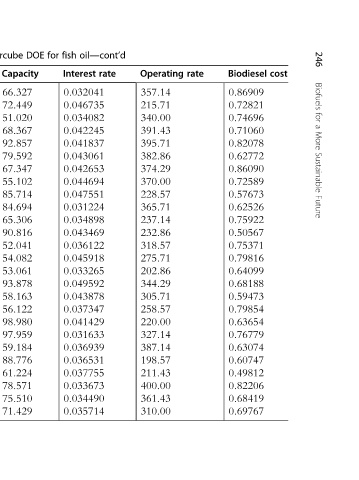
Latin price
the
by Feedstock 387.76 375.51 259.18 197.96 314.29 130.61 338.78 191.84 228.57 173.47 381.63 161.22 271.43 344.90 289.80 216.33 142.86 400.00 320.41 357.14 112.24 302.04 155.10 326.53 210.20 283.67
provided
values efficiency
factor
of conversion
Combinations Biodiesel 0.91796 0.95551 0.94898 0.97347 0.92612 0.92286 0.91633 0.91469 0.93918 0.94245 0.91143 0.90000 0.90490 0.92939 0.94408 0.92122 0.94735 0.96694 0.95878 0.93102 0.93592 0.92449 0.95714 0.95061 0.90327 0.97837
8.4
Table Run 25 26 27 28 29 30 31 32 33 34 35 36 37 38 39 40 41 42 43 44 45 46 47 48 49 50