
Page 281 - Biofuels for a More Sustainable Future
P. 281
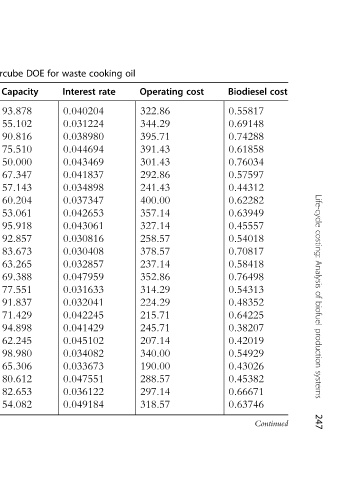
Life-cycle costing: Analysis of biofuel production systems  247


                  cost                                                        Continued
                  Biodiesel  0.55817  0.69148  0.74288  0.61858  0.76034  0.57597  0.44312  0.62282  0.63949  0.45557  0.54018  0.70817  0.58418  0.76498  0.54313  0.48352  0.64225  0.38207  0.42019  0.54929  0.43026  0.45382  0.66671  0.63746


                  cost
                  Operating  322.86  344.29  395.71  391.43  301.43  292.86  241.43  400.00  357.14  327.14  258.57  378.57  237.14  352.86  314.29  224.29  215.71  245.71  207.14  340.00  190.00  288.57  297.14  318.57


               oil
               cooking  rate


               waste  Interest  0.040204  0.031224  0.038980  0.044694  0.043469  0.041837  0.034898  0.037347  0.042653  0.043061  0.030816  0.030408  0.032857  0.047959  0.031633  0.032041  0.042245  0.041429  0.045102  0.034082  0.033673  0.047551  0.036122  0.049184

               for
               DOE  Capacity
               hypercube  93.878  55.102  90.816  75.510  50.000  67.347  57.143  60.204  53.061  95.918  92.857  83.673  63.265  69.388  77.551  91.837  71.429  94.898  62.245  98.980  65.306  80.612  82.653  54.082


               Latin  price

               the
               by  Feedstock  146.94  220.41  251.02  110.20  287.76  159.18  67.347  97.959  122.45  36.735  189.80  238.78  226.53  263.27  134.69  177.55  300.00  42.857  73.469  128.57  116.33  55.102  275.51  153.06
               provided


               values  efficiency

               factor

               of  conversion
               Combinations  Biodiesel  0.98000  0.96857  0.94571  0.95061  0.95224  0.96531  0.96204  0.97673  0.90980  0.93755  0.90327  0.92122  0.95714  0.92286  0.96041  0.97510  0.95388  0.90490  0.90816  0.93265  0.92612  0.97837  0.97020  0.94245


               8.5
               Table  Run  1  2  3  4  5  6  7  8  9  10  11  12  13  14  15  16  17  18  19  20  21  22  23  24