
Page 284 - Biofuels for a More Sustainable Future
P. 284
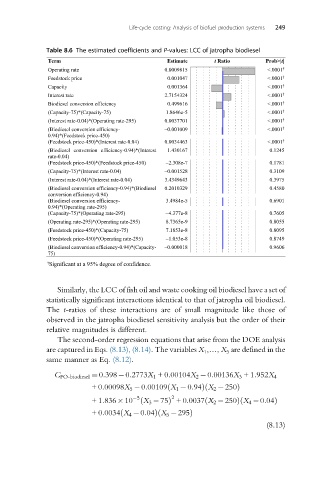
Life-cycle costing: Analysis of biofuel production systems  249


              Table 8.6 The estimated coefficients and P-values: LCC of jatropha biodiesel
              Term                            Estimate     t Ratio       Prob>|t|
              Operating rate                  0.0009815                  <.0001 †
              Feedstock price                 0.001047                   <.0001 †
              Capacity                        –0.001364                  <.0001 †
              Interest rate                   2.7154324                  <.0001 †
              Biodiesel conversion efficiency  –0.499616                 <.0001 †
              (Capacity-75)*(Capacity-75)     1.8646e-5                  <.0001 †
              (Interest rate-0.04)*(Operating rate-295)  0.0037701       <.0001 †
              (Biodiesel conversion efficiency-  –0.001009               <.0001 †
              0.94)*(Feedstock price-450)
              (Feedstock price-450)*(Interest rate-0.04)  0.0034463      <.0001 †
              (Biodiesel conversion efficiency-0.94)*(Interest   –1.430167  0.1245
              rate-0.04)
              (Feedstock price-450)*(Feedstock price-450)  –2.308e-7      0.1781
              (Capacity-75)*(Interest rate-0.04)  –0.001528               0.3109
              (Interest rate-0.04)*(Interest rate-0.04)  3.4349643        0.3975
              (Biodiesel conversion efficiency-0.94)*(Biodiesel   0.2010329  0.4580
              conversion efficiency-0.94)
              (Biodiesel conversion efficiency-   3.4984e-5               0.6901
              0.94)*(Operating rate-295)
              (Capacity-75)*(Operating rate-295)  –4.377e-8               0.7605
              (Operating rate-295)*(Operating rate-295)  8.7365e-9        0.8055
              (Feedstock price-450)*(Capacity-75)  7.1853e-8              0.8095
              (Feedstock price-450)*(Operating rate-295)  –1.053e-8       0.8749
              (Biodiesel conversion efficiency-0.94)*(Capacity-  –0.000018  0.9606
              75)
              † Significant at a 95% degree of confidence.


                 Similarly, the LCC of fish oil and waste cooking oil biodiesel have a set of
              statistically significant interactions identical to that of jatropha oil biodiesel.
              The t-ratios of these interactions are of small magnitude like those of
              observed in the jatropha biodiesel sensitivity analysis but the order of their
              relative magnitudes is different.
                 The second-order regression equations that arise from the DOE analysis
              are captured in Eqs. (8.13), (8.14). The variables X 1 ,…, X 5 are defined in the
              same manner as Eq. (8.12).

                C FO-biodiesel ¼ 0:398 0:2773X 1 +0:00104X 2  0:00136X 3 +1:952X 4
                                              ð
                                                        ð
                          +0:00098X 5  0:00109 X 1  0:94Þ X 2  250Þ
                                      5        2
                                                                  ð
                                                        ð
                          +1:836 10 ð   X 3  75Þ +0:0037 X 2  250Þ X 4  0:04Þ
                          +0:0034 X 4  0:04ð  Þ X 5  295Þ
                                            ð
                                                                         (8.13)