
Page 395 - Biofuels for a More Sustainable Future
P. 395
Prioritization of biofuels production pathways under uncertainties 351
Then, the presented interval GRA method can be used to rank these
three alternative bioethanol production pathways. According to
Eqs. (12.18), (12.19), the data presented in Table 12.3 can be normalized.
It is worth pointing out that the first five criteria including CC, TA, H.
Tox, OMF, and LCC are cost-type criteria, thus, the data of the three bio-
fuel production pathways with respect to these five criteria can be normal-
ized by Eq. (12.19), and the other three criteria including SB, CEM, and FS
are benefit-type criteria, thus, the data of the three biofuel production path-
ways with respect to these three criteria can be normalized by Eq. (12.18).
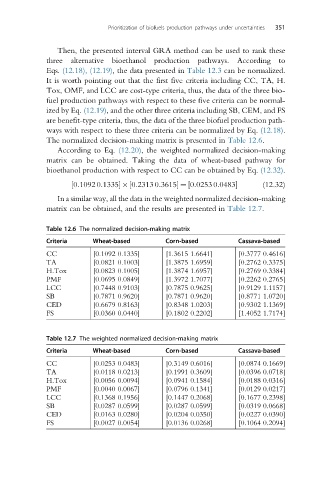
The normalized decision-making matrix is presented in Table 12.6.
According to Eq. (12.20), the weighted normalized decision-making
matrix can be obtained. Taking the data of wheat-based pathway for
bioethanol production with respect to CC can be obtained by Eq. (12.32).
(12.32)
½
½
½ 0:10920:1335 0:23130:3615 ¼ 0:02530:0483
In a similar way, all the data in the weighted normalized decision-making
matrix can be obtained, and the results are presented in Table 12.7.
Table 12.6 The normalized decision-making matrix
Criteria Wheat-based Corn-based Cassava-based
CC [0.1092 0.1335] [1.3615 1.6641] [0.3777 0.4616]
TA [0.0821 0.1003] [1.3875 1.6959] [0.2762 0.3375]
H.Tox [0.0823 0.1005] [1.3874 1.6957] [0.2769 0.3384]
PMF [0.0695 0.0849] [1.3972 1.7077] [0.2262 0.2765]
LCC [0.7448 0.9103] [0.7875 0.9625] [0.9129 1.1157]
SB [0.7871 0.9620] [0.7871 0.9620] [0.8771 1.0720]
CED [0.6679 0.8163] [0.8348 1.0203] [0.9302 1.1369]
FS [0.0360 0.0440] [0.1802 0.2202] [1.4052 1.7174]
Table 12.7 The weighted normalized decision-making matrix
Criteria Wheat-based Corn-based Cassava-based
CC [0.0253 0.0483] [0.3149 0.6016] [0.0874 0.1669]
TA [0.0118 0.0213] [0.1991 0.3609] [0.0396 0.0718]
H.Tox [0.0056 0.0094] [0.0941 0.1584] [0.0188 0.0316]
PMF [0.0040 0.0067] [0.0796 0.1341] [0.0129 0.0217]
LCC [0.1368 0.1956] [0.1447 0.2068] [0.1677 0.2398]
SB [0.0287 0.0599] [0.0287 0.0599] [0.0319 0.0668]
CED [0.0163 0.0280] [0.0204 0.0350] [0.0227 0.0390]
FS [0.0027 0.0054] [0.0136 0.0268] [0.1064 0.2094]