
Page 125 - Biomass Gasification, Pyrolysis And Torrefaction Practical Design and Theory
P. 125
Chapter | 4 Torrefaction 103
Thereafter, the heat is transferred to its interior by conduction and pore convec-
tion. Thus, one would expect a negative temperature gradient between the
torrefaction reactor, particle surface, and its interior (core).
For finer particles with low Biot number, the temperature difference
between the particle surface and its core is small. In case of large particles,
however, the Biot number being larger, one could expect a finite temperature
difference between the biomass core and its outer surface.
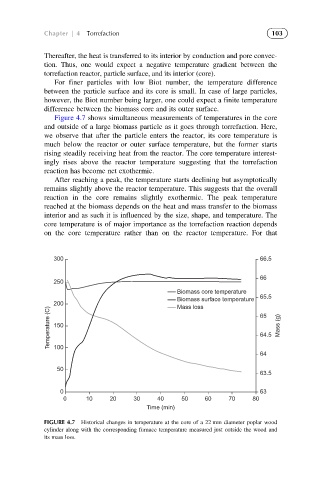
Figure 4.7 shows simultaneous measurements of temperatures in the core
and outside of a large biomass particle as it goes through torrefaction. Here,
we observe that after the particle enters the reactor, its core temperature is
much below the reactor or outer surface temperature, but the former starts
rising steadily receiving heat from the reactor. The core temperature interest-
ingly rises above the reactor temperature suggesting that the torrefaction
reaction has become net exothermic.
After reaching a peak, the temperature starts declining but asymptotically
remains slightly above the reactor temperature. This suggests that the overall
reaction in the core remains slightly exothermic. The peak temperature
reached at the biomass depends on the heat and mass transfer to the biomass
interior and as such it is influenced by the size, shape, and temperature. The
core temperature is of major importance as the torrefaction reaction depends
on the core temperature rather than on the reactor temperature. For that
300 66.5
66
250
Biomass core temperature
65.5
Biomass surface temperature
200 Mass loss
Temperature (C) 150 65 Mass (g)
64.5
100
64
50
63.5
0 63
0 10 20 30 40 50 60 70 80
Time (min)
FIGURE 4.7 Historical changes in temperature at the core of a 22 mm diameter poplar wood
cylinder along with the corresponding furnace temperature measured just outside the wood and
its mass loss.