
Page 498 - Biomedical Engineering and Design Handbook Volume 2, Applications
P. 498
476 REHABILITATION ENGINEERING AND PROSTHETICS DESIGN
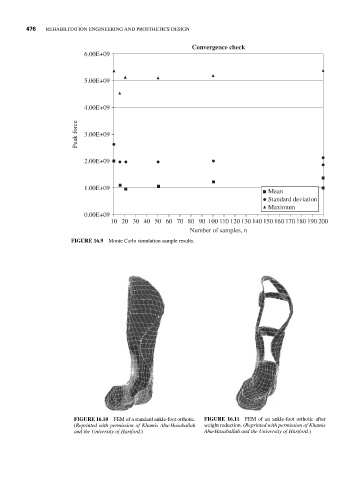
Convergence check
6.00E+09
5.00E+09
4.00E+09
Peak force 3.00E+09
2.00E+09
1.00E+09
Mean
Standard deviation
Maximum
0.00E+09
10 20 30 40 50 60 70 80 90 100 110 120 130 140 150 160 170 180 190 200
Number of samples, n
FIGURE 16.9 Monte Carlo simulation sample results.
FIGURE 16.10 FEM of a standard ankle-foot orthotic. FIGURE 16.11 FEM of an ankle-foot orthotic after
(Reprinted with permission of Khamis Abu-Hasaballah weight reduction. (Reprinted with permission of Khamis
and the University of Hartford.) Abu-Hasaballah and the University of Hartford.)