
Page 33 - Biosystems Engineering
P. 33
14 Cha pte r O n e
proportionally through the chemical reactions. Chemical dyes (often
green and red in microarray experiments [e.g., Cy3 and Cy5]) are bound
to the sequences to allow for subsequent analysis of concentration. A
solution of this dyed cDNA is created and exposed to the microarray.
On the microarray, the cDNA sequences bind, or hybridize, to the
probes that contain their complementary sequence. After a prescribed
amount of time, the remaining cDNA solution is washed off the chip.
What remains are the probes and the cDNA sequences that hybridized
with them. The microarray is scanned with a laser set at the wavelength
of the dye’s color. The fluorescent intensity of each spot indicates
approximately how many copies of the gene are bound to the spot, and
thus, a relative perspective of the expression of that gene in the cell.
Unfortunately, fluorescence alone tells us very little when the
gene expression from only one population is used; we cannot directly
correlate the fluorescence of a probe to the copies of a gene on that
probe. To alleviate the problem, we can add a second population
whose cDNA sequences were treated with a different dye. This sec-
ond population can be used as a control population; in the case of
time series data, the second (control) population is often the cell pop-
ulation at a fixed point of time, whereas the first population is the
same cell population at a later time. The two dyes should have colors
of significantly different wavelengths to avoid “crosstalk” (i.e., a situ-
ation where one dye affects the measured fluorescence of the other).
The relative difference in fluorescence of the two dyes on a particular
spot should tell us how much a gene’s expression differs between the
two populations. Expression levels can be reported as some form of
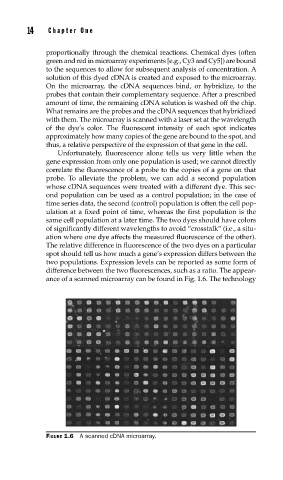
difference between the two fluorescences, such as a ratio. The appear-
ance of a scanned microarray can be found in Fig. 1.6. The technology
FIGURE 1.6 A scanned cDNA microarray.