
Page 34 - Biosystems Engineering
P. 34
Micr oarray Data Analysis Using Machine Learning Methods 15
is young and still has some problems. First, the fluorescence signal is
unlikely to exactly match the level of expression of each gene. The
target solution used is far from a free solution; the distribution of a
certain cDNA sequence through the solution is not even. This prob-
lem may be partially alleviated by devoting several spots on the
microarray to each gene and averaging the results, but it cannot guar-
antee the elimination of the problem. cDNA probes with similar, but
not identical, sequences to a particular spot on the microarray may
still hybridize to the spot with mixed results, exaggerating the expres-
sion of one gene, possibly at the expense of another. Kerr et al. (2001)
named array effects, dye effects, populations, and genes as source of
variation that have a significant effect on the relative expression of a
gene from these microarray experiments. This variation can be viewed
in terms of “noise” in a signal of gene expression for each gene.
1.3.2 High-Density Oligonucleotide Array
Oligonucleotide microarrays use a matrix of probes formed through
a photolithographic printing. For example, Affymetrix GeneChip
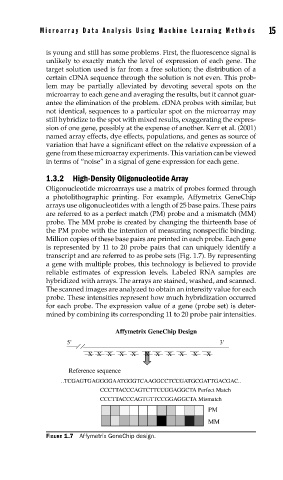
arrays use oligonucleotides with a length of 25 base pairs. These pairs
are referred to as a perfect match (PM) probe and a mismatch (MM)
probe. The MM probe is created by changing the thirteenth base of
the PM probe with the intention of measuring nonspecific binding.
Million copies of these base pairs are printed in each probe. Each gene
is represented by 11 to 20 probe pairs that can uniquely identify a
transcript and are referred to as probe sets (Fig. 1.7). By representing
a gene with multiple probes, this technology is believed to provide
reliable estimates of expression levels. Labeled RNA samples are
hybridized with arrays. The arrays are stained, washed, and scanned.
The scanned images are analyzed to obtain an intensity value for each
probe. These intensities represent how much hybridization occurred
for each probe. The expression value of a gene (probe set) is deter-
mined by combining its corresponding 11 to 20 probe pair intensities.
Affymetrix GeneChip Design
5’ 3’
X X X X X X X X X X X
Reference sequence
..TCGAGTGAGGGGAATGGGTCAAGGCCTCCGATGCGATTGACGAC..
CCCTTACCCAGTCTTCCGGAGGCTA Perfect Match
CCCTTACCCAGTGTTCCGGAGGCTA Mismatch
PM
MM
FIGURE 1.7 Affymetrix GeneChip design.