
Page 80 - Bridge and Highway Structure Rehabilitation and Repair
P. 80
CHAPTER 2 DIAGNOSTIC DESIGN AND SELECTIVE RECONSTRUCTION 55
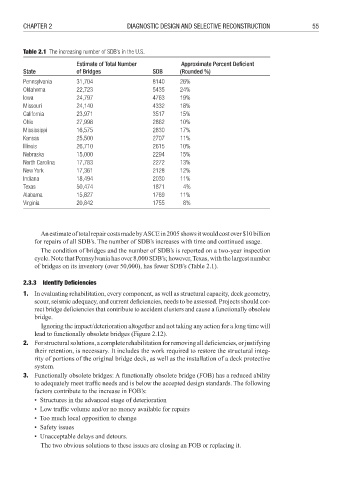
Table 2.1 The increasing number of SDB’s in the U.S.
Estimate of Total Number Approximate Percent Deficient
State of Bridges SDB (Rounded %)
Pennsylvania 31,704 8140 26%
Oklahoma 22,723 5435 24%
Iowa 24,797 4763 19%
Missouri 24,140 4332 18%
California 23,971 3517 15%
Ohio 27,998 2862 10%
Mississippi 16,575 2830 17%
Kansas 25,500 2707 11%
Illinois 26,710 2615 10%
Nebraska 15,000 2294 15%
North Carolina 17,783 2272 13%
New York 17,361 2128 12%
Indiana 18,494 2030 11%
Texas 50,474 1871 4%
Alabama 15,827 1769 11%
Virginia 20,842 1755 8%
An estimate of total repair costs made by ASCE in 2005 shows it would cost over $10 billion
for repairs of all SDB’s. The number of SDB’s increases with time and continued usage.
The condition of bridges and the number of SDB’s is reported on a two-year inspection
cycle. Note that Pennsylvania has over 8,000 SDB’s; however, Texas, with the largest number
of bridges on its inventory (over 50,000), has fewer SDB’s (Table 2.1).
2.3.3 Identify Defi ciencies
1. In evaluating rehabilitation, every component, as well as structural capacity, deck geometry,
scour, seismic adequacy, and current deficiencies, needs to be assessed. Projects should cor-
rect bridge deficiencies that contribute to accident clusters and cause a functionally obsolete
bridge.
Ignoring the impact/deterioration altogether and not taking any action for a long time will
lead to functionally obsolete bridges (Figure 2.12).
2. For structural solutions, a complete rehabilitation for removing all deficiencies, or justifying
their retention, is necessary. It includes the work required to restore the structural integ-
rity of portions of the original bridge deck, as well as the installation of a deck protective
system.
3. Functionally obsolete bridges: A functionally obsolete bridge (FOB) has a reduced ability
to adequately meet traffic needs and is below the accepted design standards. The following
factors contribute to the increase in FOB’s:
• Structures in the advanced stage of deterioration
• Low traffic volume and/or no money available for repairs
• Too much local opposition to change
• Safety issues
• Unacceptable delays and detours.
The two obvious solutions to these issues are closing an FOB or replacing it.