
Page 79 - Bridge and Highway Structure Rehabilitation and Repair
P. 79
54 SECTION 1 ADMINISTRATIVE ISSUES
2.3.2 Survey of Structural Deficiencies and the Need for Rehabilitation
In this chapter, the need for diagnostic and preservation design and maintenance principles
is discussed. The role of the federal government and states for overseeing and funding is ad-
dressed. While original construction is based on routine design, selective reconstruction is based
on diagnostic and preservation design. Design issues for the historic and covered bridges are
highlighted.
1. Bridge is not structurally deficient: Only minor repairs may be required. It appears that a
percentage over 5 percent deficient is a cause of concern in terms of monitoring and reha-
bilitation, or even replacement.
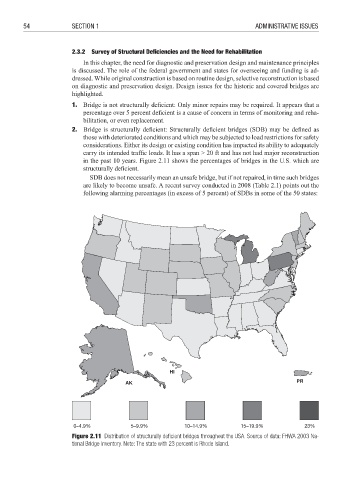
2. Bridge is structurally deficient: Structurally deficient bridges (SDB) may be defi ned as
those with deteriorated conditions and which may be subjected to load restrictions for safety
considerations. Either its design or existing condition has impacted its ability to adequately
carry its intended traffi c loads. It has a span > 20 ft and has not had major reconstruction
in the past 10 years. Figure 2.11 shows the percentages of bridges in the U.S. which are
structurally defi cient.
SDB does not necessarily mean an unsafe bridge, but if not repaired, in time such bridges
are likely to become unsafe. A recent survey conducted in 2008 (Table 2.1) points out the
following alarming percentages (in excess of 5 percent) of SDBs in some of the 50 states:
HI
AK PR
0–4.9% 5–9.9% 10–14.9% 15–19.9% 23%
Figure 2.11 Distribution of structurally defi cient bridges throughout the USA. Source of data: FHWA 2003 Na-
tional Bridge Inventory. Note: The state with 23 percent is Rhode Island.