
Page 117 - Building Big Data Applications
P. 117
114 Building Big Data Applications
unstructured data processing. The new approach to visualization can be defined as the
following:
Data discovery visualizationdthe viewpoints of touching and seeing the raw data
first, prior to deciding what is needed. In this stage, we are not looking at concep-
tual models or logical models of data, we are looking at identifying the data and its
characteristics, its completeness, its formats, its variances, and all the different
sources delivering similar data. The exercise will provide users the ability to discover
data, align notes as comments, understand the business value, document opera-
tional analytics to be delivered from the data, provide data stewards guidance for
the usage of the data in the data lake, data hubs, analytics, reporting, and visualiza-
tion. This exercise needs to be delivered by a team of business experts on data, data
analysts, and the data steward team providing the governance required for the
discovery and exploration. The deliverables from this exercise will be a set of data
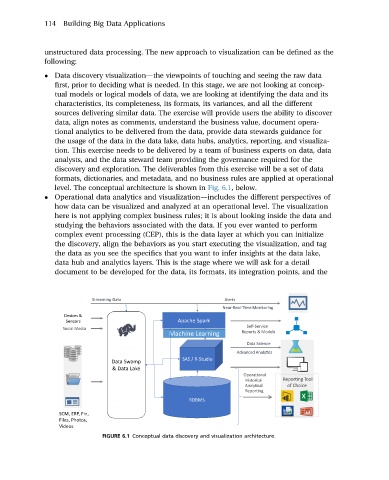
formats, dictionaries, and metadata, and no business rules are applied at operational
level. The conceptual architecture is shown in Fig. 6.1,below.
Operational data analytics and visualizationdincludes the different perspectives of
how data can be visualized and analyzed at an operational level. The visualization
here is not applying complex business rules; it is about looking inside the data and
studying the behaviors associated with the data. If you ever wanted to perform
complex event processing (CEP), this is the data layer at which you can initialize
the discovery, align the behaviors as you start executing the visualization, and tag
the data as you see the specifics that you want to infer insights at the data lake,
data hub and analytics layers. This is the stage where we will ask for a detail
document to be developed for the data, its formats, its integration points, and the
Streaming Data Alerts
Near-Real-Time Monitoring
Devices &
Sensors Apache Spark
Self-Service
Social Media
Machine Learning Reports & Models
Data Science
Operational
Data Store Advanced Analy cs
SAS / R-Studio
Data Swamp
& Data Lake
Operational
Historical Repor ng Tool
Analytical of Choice
Repor ng
Master RDBMS
Data
SCM, ERP, Fin,
Files, Photos,
Videos
FIGURE 6.1 Conceptual data discovery and visualization architecture.