
Page 120 - Building Big Data Applications
P. 120
Chapter 6 Visualization, storyboarding and applications 117
Markets
Analy cal
Customers Products
Visualiza on
Compe on
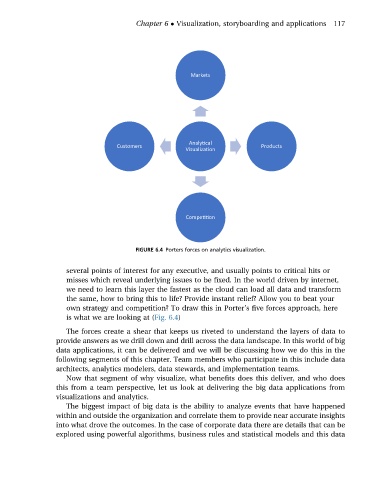
FIGURE 6.4 Porters forces on analytics visualization.
several points of interest for any executive, and usually points to critical hits or
misses which reveal underlying issues to be fixed. In the world driven by internet,
we need to learn this layer the fastest as the cloud can load all data and transform
the same, how to bring this to life? Provide instant relief? Allow you to beat your
own strategy and competition? To draw this in Porter’s five forces approach, here
is what we are looking at (Fig. 6.4)
The forces create a shear that keeps us riveted to understand the layers of data to
provide answers as we drill down and drill across the data landscape. In this world of big
data applications, it can be delivered and we will be discussing how we do this in the
following segments of this chapter. Team members who participate in this include data
architects, analytics modelers, data stewards, and implementation teams.
Now that segment of why visualize, what benefits does this deliver, and who does
this from a team perspective, let us look at delivering the big data applications from
visualizations and analytics.
The biggest impact of big data is the ability to analyze events that have happened
within and outside the organization and correlate them to provide near accurate insights
into what drove the outcomes. In the case of corporate data there are details that can be
explored using powerful algorithms, business rules and statistical models and this data