
Page 148 - Building Big Data Applications
P. 148
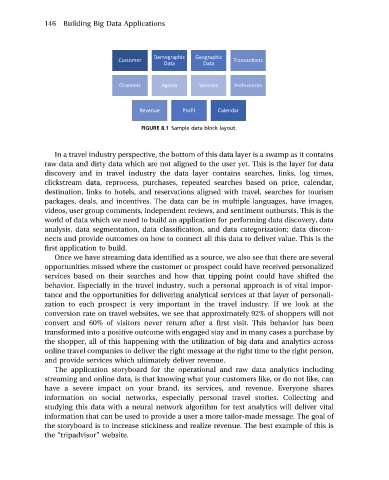
146   Building Big Data Applications


                                            Demographic   Geographic
                                  Customer                        Transac ons
                                              Data       Data
                                  Channels    Agents    Vendors   Preferences


                                        Revenue     Profit    Calendar

                                        FIGURE 8.1 Sample data block layout.


                In a travel industry perspective, the bottom of this data layer is a swamp as it contains
             raw data and dirty data which are not aligned to the user yet. This is the layer for data
             discovery and in travel industry the data layer contains searches, links, log times,
             clickstream data, reprocess, purchases, repeated searches based on price, calendar,
             destination, links to hotels, and reservations aligned with travel, searches for tourism
             packages, deals, and incentives. The data can be in multiple languages, have images,
             videos, user group comments, independent reviews, and sentiment outbursts. This is the
             world of data which we need to build an application for performing data discovery, data
             analysis, data segmentation, data classification, and data categorization; data discon-
             nects and provide outcomes on how to connect all this data to deliver value. This is the
             first application to build.
                Once we have streaming data identified as a source, we also see that there are several
             opportunities missed where the customer or prospect could have received personalized
             services based on their searches and how that tipping point could have shifted the
             behavior. Especially in the travel industry, such a personal approach is of vital impor-
             tance and the opportunities for delivering analytical services at that layer of personali-
             zation to each prospect is very important in the travel industry. If we look at the
             conversion rate on travel websites, we see that approximately 92% of shoppers will not
             convert and 60% of visitors never return after a first visit. This behavior has been
             transformed into a positive outcome with engaged stay and in many cases a purchase by
             the shopper, all of this happening with the utilization of big data and analytics across
             online travel companies to deliver the right message at the right time to the right person,
             and provide services which ultimately deliver revenue.
                The application storyboard for the operational and raw data analytics including
             streaming and online data, is that knowing what your customers like, or do not like, can
             have a severe impact on your brand, its services, and revenue. Everyone shares
             information on social networks, especially personal travel stories. Collecting and
             studying this data with a neural network algorithm for text analytics will deliver vital
             information that can be used to provide a user a more tailor-made message. The goal of
             the storyboard is to increase stickiness and realize revenue. The best example of this is
             the “tripadvisor” website.