
Page 124 - Buried Pipe Design
P. 124
Design of Gravity Flow Pipes 99
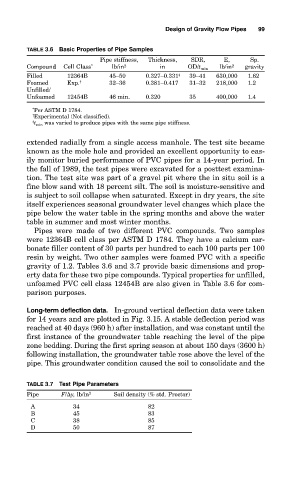
TABLE 3.6 Basic Properties of Pipe Samples
Pipe stiffness, Thickness, SDR, E, Sp.
Compound Cell Class * lb/in 2 in OD/t min lb/in 2 gravity
Filled 12364B 45–50 0.327–0.331 ‡ 39–41 630,000 1.62
Foamed Exp. † 32–36 0.381–0.417 31–32 218,000 1.2
Unfilled/
Unfoamed 12454B 46 min. 0.320 35 400,000 1.4
* Per ASTM D 1784.
† Experimental (Not classified).
‡ t was varied to produce pipes with the same pipe stiffness.
min
extended radially from a single access manhole. The test site became
known as the mole hole and provided an excellent opportunity to eas-
ily monitor buried performance of PVC pipes for a 14-year period. In
the fall of 1989, the test pipes were excavated for a posttest examina-
tion. The test site was part of a gravel pit where the in situ soil is a
fine blow sand with 18 percent silt. The soil is moisture-sensitive and
is subject to soil collapse when saturated. Except in dry years, the site
itself experiences seasonal groundwater level changes which place the
pipe below the water table in the spring months and above the water
table in summer and most winter months.
Pipes were made of two different PVC compounds. Two samples
were 12364B cell class per ASTM D 1784. They have a calcium car-
bonate filler content of 30 parts per hundred to each 100 parts per 100
resin by weight. Two other samples were foamed PVC with a specific
gravity of 1.2. Tables 3.6 and 3.7 provide basic dimensions and prop-
erty data for these two pipe compounds. Typical properties for unfilled,
unfoamed PVC cell class 12454B are also given in Table 3.6 for com-
parison purposes.
Long-term deflection data. In-ground vertical deflection data were taken
for 14 years and are plotted in Fig. 3.15. A stable deflection period was
reached at 40 days (960 h) after installation, and was constant until the
first instance of the groundwater table reaching the level of the pipe
zone bedding. During the first spring season at about 150 days (3600 h)
following installation, the groundwater table rose above the level of the
pipe. This groundwater condition caused the soil to consolidate and the
TABLE 3.7 Test Pipe Parameters
Pipe F/ y, lb/in 2 Soil density (% std. Proctor)
A 34 82
B 45 83
C 38 85
D 50 87