
Page 194 - Buried Pipe Design
P. 194
168 Chapter Three
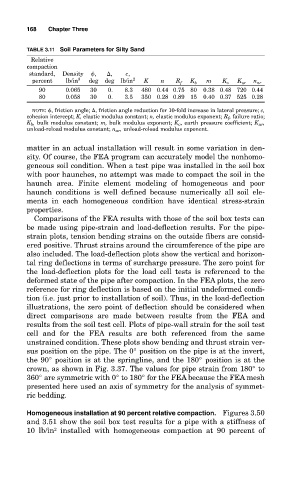
TABLE 3.11 Soil Parameters for Silty Sand
Relative
compaction
standard, Density
, , c,
percent lb/in 3 deg deg lb/in 2 K n R f K b m K o K ur n nr
90 0.065 30 0. 8.3 480 0.44 0.75 80 0.38 0.48 720 0.44
80 0.058 30 0. 3.5 350 0.28 0.89 15 0.40 0.37 525 0.28
NOTE:
, friction angle; , friction angle reduction for 10-fold increase in lateral pressure; c,
cohesion intercept; K, elastic modulus constant; n, elastic modulus exponent; R f , failure ratio;
K b , bulk modulus constant; m, bulk modulus exponent; K o , earth pressure coefficient; K ur ,
unload-reload modulus constant; n ur , unload-reload modulus exponent.
matter in an actual installation will result in some variation in den-
sity. Of course, the FEA program can accurately model the nonhomo-
geneous soil condition. When a test pipe was installed in the soil box
with poor haunches, no attempt was made to compact the soil in the
haunch area. Finite element modeling of homogeneous and poor
haunch conditions is well defined because numerically all soil ele-
ments in each homogeneous condition have identical stress-strain
properties.
Comparisons of the FEA results with those of the soil box tests can
be made using pipe-strain and load-deflection results. For the pipe-
strain plots, tension bending strains on the outside fibers are consid-
ered positive. Thrust strains around the circumference of the pipe are
also included. The load-deflection plots show the vertical and horizon-
tal ring deflections in terms of surcharge pressure. The zero point for
the load-deflection plots for the load cell tests is referenced to the
deformed state of the pipe after compaction. In the FEA plots, the zero
reference for ring deflection is based on the initial undeformed condi-
tion (i.e. just prior to installation of soil). Thus, in the load-deflection
illustrations, the zero point of deflection should be considered when
direct comparisons are made between results from the FEA and
results from the soil test cell. Plots of pipe-wall strain for the soil test
cell and for the FEA results are both referenced from the same
unstrained condition. These plots show bending and thrust strain ver-
sus position on the pipe. The 0° position on the pipe is at the invert,
the 90° position is at the springline, and the 180° position is at the
crown, as shown in Fig. 3.37. The values for pipe strain from 180° to
360° are symmetric with 0° to 180° for the FEA because the FEA mesh
presented here used an axis of symmetry for the analysis of symmet-
ric bedding.
Homogeneous installation at 90 percent relative compaction. Figures 3.50
and 3.51 show the soil box test results for a pipe with a stiffness of
2
10 lb/in installed with homogeneous compaction at 90 percent of