
Page 255 - Buried Pipe Design
P. 255
Design of Pressure Pipes 229
–
× ×
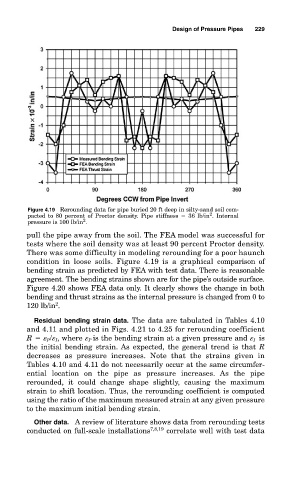
Figure 4.19 Rerounding data for pipe buried 20 ft deep in silty-sand soil com-
2
pacted to 80 percent of Proctor density. Pipe stiffness 36 lb/in . Internal
2
pressure is 100 lb/in .
pull the pipe away from the soil. The FEA model was successful for
tests where the soil density was at least 90 percent Proctor density.
There was some difficulty in modeling rerounding for a poor haunch
condition in loose soils. Figure 4.19 is a graphical comparison of
bending strain as predicted by FEA with test data. There is reasonable
agreement. The bending strains shown are for the pipe’s outside surface.
Figure 4.20 shows FEA data only. It clearly shows the change in both
bending and thrust strains as the internal pressure is changed from 0 to
2
120 lb/in .
Residual bending strain data. The data are tabulated in Tables 4.10
and 4.11 and plotted in Figs. 4.21 to 4.25 for rerounding coefficient
R P / I , where P is the bending strain at a given pressure and I is
the initial bending strain. As expected, the general trend is that R
decreases as pressure increases. Note that the strains given in
Tables 4.10 and 4.11 do not necessarily occur at the same circumfer-
ential location on the pipe as pressure increases. As the pipe
rerounded, it could change shape slightly, causing the maximum
strain to shift location. Thus, the rerounding coefficient is computed
using the ratio of the maximum measured strain at any given pressure
to the maximum initial bending strain.
Other data. A review of literature shows data from rerounding tests
conducted on full-scale installations 7,8,19 correlate well with test data