
Page 48 - Calculus Demystified
P. 48
Basics
CHAPTER 1
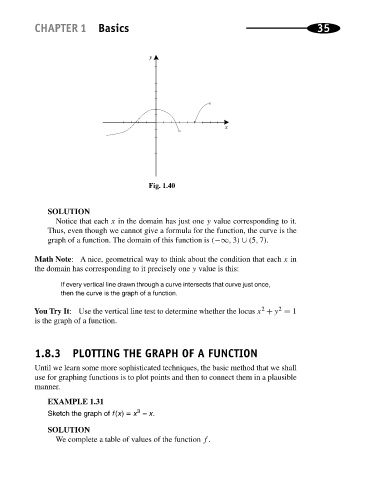
Fig. 1.40 35
SOLUTION
Notice that each x in the domain has just one y value corresponding to it.
Thus, even though we cannot give a formula for the function, the curve is the
graph of a function. The domain of this function is (−∞, 3) ∪ (5, 7).
Math Note: A nice, geometrical way to think about the condition that each x in
the domain has corresponding to it precisely one y value is this:
If every vertical line drawn through a curve intersects that curve just once,
then the curve isthe graph of a function.
2
2
You Try It: Use the vertical line test to determine whether the locus x + y = 1
is the graph of a function.
1.8.3 PLOTTING THE GRAPH OF A FUNCTION
Until we learn some more sophisticated techniques, the basic method that we shall
use for graphing functions is to plot points and then to connect them in a plausible
manner.
EXAMPLE 1.31
3
Sketch the graph of f(x) = x − x.
SOLUTION
We complete a table of values of the function f .