
Page 80 - Calculus Demystified
P. 80
Foundations of Calculus
CHAPTER 2
length of that interval shrink to zero to determine the instantaneous velocity. To 67
carry out this program, imagine a short interval [c, c + h]. The average velocity of
the moving body over that interval is
ϕ(c + h) − ϕ(c)
v av ≡ .
h
Thisisafamiliarexpression(see(∗)).Asweleth → 0,weknowthatthisexpression
tends to the derivative of ϕ at c. On the other hand, it is reasonable to declare this
limit to be the instantaneous velocity. We have discovered the following important
rule:
Let ϕ be a differentiable function on an interval (a, b). Suppose that ϕ(t)
represents the position of a moving body. Let c ∈ (a, b). Then
ϕ (c ) = instantaneous velocity of the moving body at c.
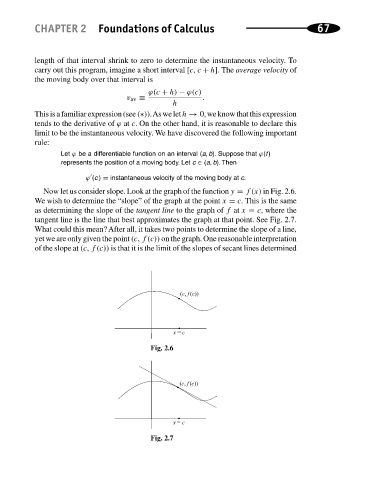
Now let us consider slope. Look at the graph of the function y = f(x) in Fig. 2.6.
We wish to determine the “slope” of the graph at the point x = c. This is the same
as determining the slope of the tangent line to the graph of f at x = c, where the
tangent line is the line that best approximates the graph at that point. See Fig. 2.7.
What could this mean? After all, it takes two points to determine the slope of a line,
yet we are only given the point (c, f (c)) on the graph. One reasonable interpretation
of the slope at (c, f (c)) is that it is the limit of the slopes of secant lines determined
Fig. 2.6
Fig. 2.7