
Page 165 - Carbon Nanotube Fibres and Yarns
P. 165
156 Carbon Nanotube Fibers and Yarns
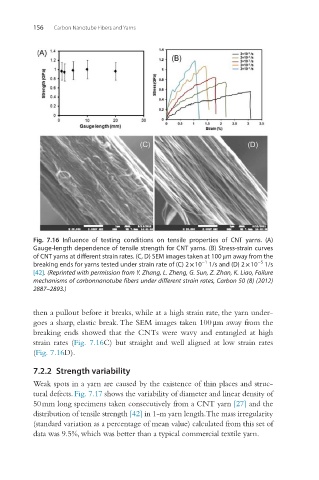
Fig. 7.16 Influence of testing conditions on tensile properties of CNT yarns. (A)
Gauge-length dependence of tensile strength for CNT yarns. (B) Stress-strain curves
of CNT yarns at different strain rates. (C, D) SEM images taken at 100 μm away from the
−5
−1
breaking ends for yarns tested under strain rate of (C) 2 × 10 1/s and (D) 2 × 10 1/s
[42]. (Reprinted with permission from Y. Zhang, L. Zheng, G. Sun, Z. Zhan, K. Liao, Failure
mechanisms of carbonnanotube fibers under different strain rates, Carbon 50 (8) (2012)
2887–2893.)
then a pullout before it breaks, while at a high strain rate, the yarn under-
goes a sharp, elastic break. The SEM images taken 100 μm away from the
breaking ends showed that the CNTs were wavy and entangled at high
strain rates (Fig. 7.16C) but straight and well aligned at low strain rates
(Fig. 7.16D).
7.2.2 Strength variability
Weak spots in a yarn are caused by the existence of thin places and struc-
tural defects. Fig. 7.17 shows the variability of diameter and linear density of
50 mm long specimens taken consecutively from a CNT yarn [27] and the
distribution of tensile strength [42] in 1-m yarn length. The mass irregularity
(standard variation as a percentage of mean value) calculated from this set of
data was 9.5%, which was better than a typical commercial textile yarn.