
Page 142 - Carbon Nanotubes
P. 142
132 P. C. EKLUND et ul.
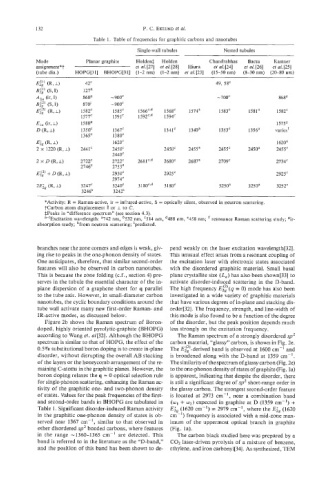
Table 1. Table of frequencies for graphitic carbons and nanotubes
Single-wall tubules Nested tubules
Mode Planar graphite Holden$ Holden Chandrabhas Bacsa Kastner
assignment * t et ul. [27] et ul. [28] Hiura et ul. [24] et al. [26] et ul. [25]
(tube dia.) HOPG[31] BHOPG[31] (1-2 nm) (1-2 nm) et ul.[23] (15-50 nm) (8-30 nm) (20-80 nm)
-
42' 49, 58'
127h
86Sg -9mc -700' 86V
870' -900'
1582' 1585' 1 566c'd 1568' 1574' 1583' 158Ia 1582e
1577= 1591e 1592C,d 1594'
158Sg 1575g
1350' 1367' 1341' 1340a 1353' 1356a variesf
1365e 1380'
1620' 1620a
2441' 2450' 2450' 24Sa 2455' 2450' 2455e
2440e
2722' 2122c 2681C*d 2680' 2687' 2709' 2734'
2746e 2153e
2950' 2925' 2925e
2974e
3247' 3240' 3 1 3180' 3250a 3250a 3252=
3246e 3242e
*Activity: R = Raman-active, ir = infrared-active, S = optically silent, observed in neutron scattering.
?Carbon atom displacement II or I to e.
$Peaks in "difference spectrum" (see section 4.3).
a-eExcitation wavelength: a742 nm, b532 nm, '514 nm, d488 nm, "458 nm; resonance Raman scattering study; 5r-
absorption study; hfrom neutron scattering; 'predicted.
branches near the zone comers and edges is weak, giv- pend weakly on the laser excitation wavelength[32].
ing rise to peaks in the one-phonon density of states. This unusual effect arises from a resonant coupling of
One anticipates, therefore, that similar second-order the excitation laser with electronic states associated
features will also be observed in carbon nanotubes. with the disordered graphitic material. Small basal
This is because the zone folding (c.f., section 4) pre- plane crystallite size (L,) has also been shown[33] to
serves in the tubule the essential character of the in- activate disorder-induced scattering in the D-band.
plane dispersion of a graphene sheet for q parallel The high frequency E$:)( q = 0) mode has also been
to the tube axis. However, in small-diameter carbon investigated in a wide variety of graphitic materials
nanotubes, the cyclic boundary conditions around the that have various degrees of in-plane and stacking dis-
tube wall activate many new first-order Raman- and order[32], The frequency, strength, and line-width of
IR-active modes, as discussed below. this mode is also found to be a function of the degree
Figure 2b shows the Raman spectrum of Boron- of the disorder, but the peak position depends much
doped, highly oriented pyrolytic-graphite (BHOPG) less strongly on the excitation frequency.
according to Wang et. aZ[32]. Although the BHOPG The Raman spectrum of a strongly disordered sp2
spectrum is similar to that of HOPG, the effect of the carbon material, "glassy" carbon, is shown in Fig. 2e.
0.5"/0 substitutional boron doping is to create in-plane The Eii'-derived band is observed at 1600 cm-' and
disorder, without disrupting the overall AB stacking is broadened along with the D-band at 1359 cm-'.
of the layers or the honeycomb arrangement of the re- The similarity of the spectrum of glassy carbon (Fig. 2e)
maining C-atoms in the graphitic planes. However, the to the one-phonon density of states of graphite (Fig. la)
boron doping relaxes the q = 0 optical selection rule is apparent, indicating that despite the disorder, there
for single-phonon scattering, enhancing the Raman ac- is still a significant degree of sp2 short-range order in
tivity of the graphitic one- and two-phonon density the glassy carbon. The strongest second-order feature
of states. Values for the peak frequencies of the first- is located at 2973 cm-', near a combination band
and second-order bands in BHOPG are tabulated in (wl + w2) expected in graphite at D (1359 m-I) +
Table 1. Significant disorder-induced Raman activity E' (1620 cm-') = 2979 cm-', where the Eig (1620
2g-
in the graphitic one-phonon density of states is ob- cm I) frequency is associated with a mid-zone max-
served near 1367 cm-', similar to that observed in imum of the uppermost optical branch in graphite
other disordered sp2 bonded carbons, where features (Fig. la).
in the range -1360-1365 cm-' are detected. This The carbon black studied here was prepared by a
band is referred to in the literature as the "D-band," C02 laser-driven pyrolysis of a mixture of benzene,
and the position of this band has been shown to de- ethylene, and iron carbonyI[34]. As synthesized, TEM