
Page 32 - Carbon Nanotubes
P. 32
Catalytic production and purification of nanotubules 23
Table 2. Hydrogen content measured by quantative with the increase of reaction temperature. The free
‘H-NMR valencies of carbon in such defects can be compen-
~
T,, (‘H)” Hydrogen sated by the formation of C-H bonds. The carbon
Sample (ms) (wt%) layers produced on the surface of silica-supported
catalysts after hydrocarbon decomposition always
Coronene (reference) 520 4.03 have chemically bonded hydrogen (up to 2 wt% in
Catalyst Co-SiO, 20 1.33 some cases).
Evacuated catalyst Co-SiO, 960 0.26
Carbonated catalyst CoSiO, 50 1.80 We performed a quantitative ‘H-NMR study using
Evacuated carbonated catalyst 160 1.26b coronene (Cz4Hlz) as external standard. The ‘H-
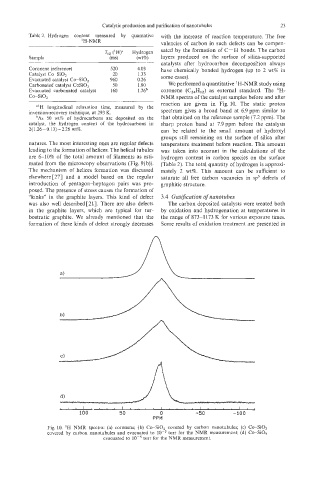
Co-SiO, NMR spectra of the catalyst samples before and after
reaction are given in Fig. 10. The static proton
”‘H longitudinal relaxation time, measured by the
inversion-recovery technique, at 293 K. spectrum gives a broad band at 6.9ppm similar to
bAs 50 wt% of hydrocarbons are deposited on the that obtained on the reference sample (7.2 ppm). The
catalyst, the hydrogen content of the hydrocarbons is: sharp proton band at 7.9 ppm before the catalysis
2( 1.26-0.13) ~2.26 wt%. can be related to the small amount of hydroxyl
groups still remaining on the surface of silica after
natures. The most interesting ones are regular defects temperature treatment before reaction. This amount
leading to the formation of helices. The helical tubules was taken into account in the calculations of the
are 6-10% of the total amount of filaments as esti- hydrogen content in carbon species on the surface
mated from the microscopy observations (Fig. 9( b)). (Table 2). The total quantity of hydrogen is approxi-
The mechanism of helices formation was discussed mately 2 wt%. This amount can be sufficient to
elsewhereC271 and a model based on the regular saturate all free carbon vacancies in sp3 defects of
introduction of pentagon-heptagon pairs was pro- graphitic structure.
posed. The presence of stress causes the formation of
“kinks” in the graphite layers. This kind of defect 3.4 Gas$cation of nanotubes
was also well describedC211. There are also defects The carbon deposited catalysts were treated both
in the graphite layers, which are typical for tur- by oxidation and hydrogenation at temperatures in
bostratic graphite. We already mentioned that the the range of 873-1173 K for various exposure times.
formation of these kinds of defect strongly decreases Some results of oxidation treatment are presented in
~ , , , ‘ , , , , i . , , , l , , , , l , l
100 50 0 -50 -100
PPM
Fig. 10. ‘H NMR spectra: (a) coronene; (b) Co-SiO, covered by carbon nanotubules; (c) Co-SiO,
covered by carbon nanotubules and evacuated to torr for the NMR measurement; (d) Co-SiO,
evacuated to torr for the NMR measurement.