
Page 64 - Carbonate Platforms Facies, Sequences, and Evolution
P. 64
56
al. ,
but
the
tool
seen
basic
cesses
model
The
in
Berger
an
in
cations,
scientist.
pretative
Useful
et
Bilodeau,
timescale,
1986;
arrived at.
it
results
that
Goldhammer,
both
a!.,
research
route,
1988;
approach
and it
results
processes
rather
additional
created
enables
1984;
1988;
are
may
sedimentology
Klein
than
the
Goldhammer
not
them.
Ross
&
technique.
that
routine
et
the
shallow-water
&
is
Spencer
be
within
themselves,
in
which are not widely available.
&
and
al.,
analysis
the
fully
Instead,
one
Ross,
Willard,
Amongst
of
programs
perhaps
1987;
1985;
1989)
Demicco,
other
objective
program
deep-water
simulation
capabilities
Read
Blair
successions through the reversal of the usual inter
(sediments and sedimentary rocks) back to the pro
appli
processes may have dominated much of the strati
simulation can provide unique insight into the im
suc
with caution and due regard to geological experience,
1989).
sedimentary
that of working from the product
close to becoming a
makes possible the direct testing
complex interactions of these over any convenient
exploring
since
can
and observation of how the product may have been
concepts (e.g. Turcotte & Willemann, 1983; House,
have appeared in recent years to test some of the
computer models of varying degrees of sophistication
These generate cyclic patterns comparable with those
&
1985; Schwarzacher & Schwarzacher, 1986; Read et
With increased interest in the possibility that cyclic
form of scientific experiment available to the earth
modelling should be regarded as potentially the best
several
&
graphic record (e.g. Vail et al., 1977; Crowell, 1978;
been written for the BBC Model B and will also run
theme of cyclic sedimentation. The programs have
series of four programs is presented based upon the
uses
machine code for speed and memory efficiency. It is
on the B+ and the Master. They use BBC BASIC
themselves
research geologists and those involved in advanced
cessions, but in most cases the work has emphasized
standard microcomputers and in this paper a unified
of
hoped that the four programs will be found useful by
teaching. They are being made generally available
of value to both research and teaching. Computer
portance and inter-relationships of specific processes
based upon rock interpretation. However, applied
much of our understanding of geological processes is
Computer simulation provides an unique analytical
G.M. Walkden and
G.D.
screen.
The
tectonic
INTRODUCTION
mentary
demand.
interactive
computers
compaction
Walkden
will
programs
column
and
effects
be
subsidence,
can
showing
simulate
be
delta
variable
a
produced
if
facies
variety
there
of
distinguished.
is
progradation,
accumulation
responses
A
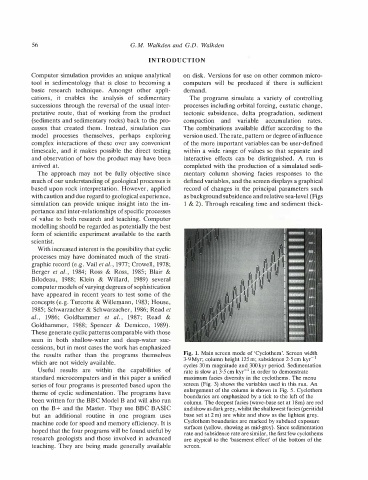
rate is slow at 3· 5 cm kyr- 1 in order to demonstrate
to
'
boundaries are emphasized by a tick to the left of the
run
maximum facies diversity in the cyclothems. The menu
3·9 Myr; column height 125 m; subsidence 2· 5cm kyr- 1
Fig. 1. Main screen mode of 'Cyclothem'. Screen width
screen (Fig. 3) shows the variables used in this run. An
base set at 2m) are white and show as the lightest grey.
Cyclothem boundaries are marked by subdued exposure
are atypical to the 'basement effect' of the bottom of the
on disk. Versions for use on other common micro
1 & 2). Through rescaling time and sediment thick-
cycles 30m magnitude and 300 kyr period. Sedimentation
completed with the production of a simulated sedi
sufficient
defined variables, and the screen displays a graphical
record of changes in the principal parameters such
is
the
column. The deepest facies (wave-base set at 18m) are red
rate and subsidence rate are similar, the first few cyclothems
as background subsidence and relative sea-level (Figs
enlargement of the column is shown in Fig. 5. Cyclothem
controlling
sediment
processes including orbital forcing, eustatic change,
The combinations available differ according to the
within a wide range of values so that separate and
of the more important variables can be user-defined
version used. The rate, pattern or degree of influence
surfaces (yellow, showing as mid-grey). Since sedimentation
and show as dark grey, whilst the shallowest facies (peritidal
rates. ·