
Page 103 - Carbonate Sedimentology and Sequence Stratigraphy
P. 103
94 WOLFGANG SCHLAGER
Pinning-point curve
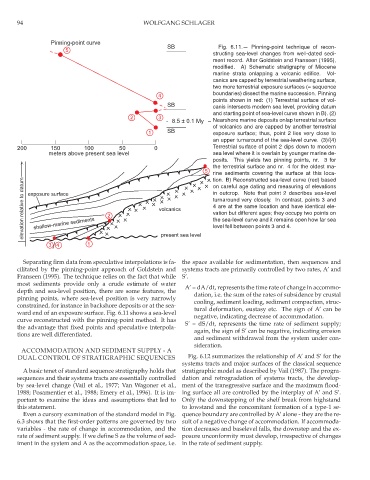
SB Fig. 6.11.— Pinning-point technique of recon-
5
structing sea-level changes from well-dated sedi-
ment record. After Goldstein and Franseen (1995),
modified. A) Schematic stratigraphy of Miocene
marine strata onlapping a volcanic edifice. Vol-
canics are capped by terrestrial weathering surface,
two more terrestrial exposure surfaces (= sequence
boundaries) dissect the marine succession. Pinning
4
points shown in red: (1) Terrestrial surface of vol-
SB canis intersects modern sea level, providing datum
and starting point of sea-level curve shown in B). (2)
2 3
8.5 ± 0.1 My Nearshore marine deposits onlap terrestrial surface
of volcanics and are capped by another terrestrial
1 SB exposure surface; thus, point 2 lies very close to
an upper turnaround of the sea-level curve. (3)/(4)
200 150 100 50 0 Terrestrial surface of point 2 dips down to modern
meters above present sea level sea level where it is overlain by younger marine de-
posits. This yields two pinning points, nr. 3 for
the terrestrial surface and nr. 4 for the oldest ma-
5
rine sediments covering the surface at this loca-
elevation relative to datum exposure surface 2 volcanics in outcrop. Note that point 2 describes sea-level
tion. B) Reconstructed sea-level curve (red) based
on careful age dating and measuring of elevations
turnaround very closely. In contrast, points 3 and
4 are at the same location and have identical ele-
vation but different ages; they occupy two points on
shallow-marine sediments
the sea-level curve and it remains open how far sea
level fell between points 3 and 4.
3 4 1 present sea level
Separating firm data from speculative interpolations is fa- the space available for sedimentation, then sequences and
cilitated by the pinning-point approach of Goldstein and systems tracts are primarily controlled by two rates, A’ and
Franseen (1995). The technique relies on the fact that while S’.
most sediments provide only a crude estimate of water
A’ = dA/dt, represents the time rate of change in accommo-
depth and sea-level position, there are some features, the
dation, i.e. the sum of the rates of subsidence by crustal
pinning points, where sea-level position is very narrowly
cooling, sediment loading, sediment compaction, struc-
constrained, for instance in backshore deposits or at the sea-
tural deformation, eustasy etc. The sign of A’ can be
ward end of an exposure surface. Fig. 6.11 shows a sea-level
negative, indicating decrease of accommodation.
curve reconstructed with the pinning-point method. It has
S’ = dS/dt, represents the time rate of sediment supply;
the advantage that fixed points and speculative interpola-
again, the sign of S’ can be negative, indicating erosion
tions are well differentiated.
and sediment withdrawal from the system under con-
sideration.
ACCOMMODATION AND SEDIMENT SUPPLY - A
DUAL CONTROL OF STRATIGRAPHIC SEQUENCES Fig. 6.12 summarizes the relationship of A’ and S’ for the
systems tracts and major surfaces of the classical sequence
A basic tenet of standard sequence stratigraphy holds that stratigraphic model as described by Vail (1987). The progra-
sequences and their systems tracts are essentially controlled dation and retrogradation of systems tracts, the develop-
by sea-level change (Vail et al., 1977; Van Wagoner et al., ment of the transgressive surface and the maximum flood-
1988; Posamentier et al., 1988; Emery et al., 1996). It is im- ing surface all are controlled by the interplay of A’ and S’.
portant to examine the ideas and assumptions that led to Only the downstepping of the shelf break from highstand
this statement. to lowstand and the concomitant formation of a type-1 se-
Even a cursory examination of the standard model in Fig. quence boundary are controlled by A’ alone - they are the re-
6.3 shows that the first-order patterns are governed by two sult of a negative change of accommodation. If accommoda-
variables - the rate of change in accommodation, and the tion decreases and baselevel falls, the downstep and the ex-
rate of sediment supply. If we define S as the volume of sed- posure unconformity must develop, irrespective of changes
iment in the system and A as the accommodation space, i.e. in the rate of sediment supply.