Page 111 - Carbonate Sedimentology and Sequence Stratigraphy
P. 111

102                                      WOLFGANG SCHLAGER


                 A)
                        Andros


                    0.6
                   TWT
                      0                                                 10 km
                 B)
                            Straits of Andros  12       Alabama Margin   12         New Jersey Margin  12
                             (carbonates)                  (mixed)                     (clastics)
                                               log2 (number full boxes)
                                           8                            8                            8


                         D = 1.32                     D = 1.37                      D = 1.48
                                           4                            4                            4


                       -8    log2 (box size)   0   -8    -6   -4   -2     0     -8   -6    -4   -2    0

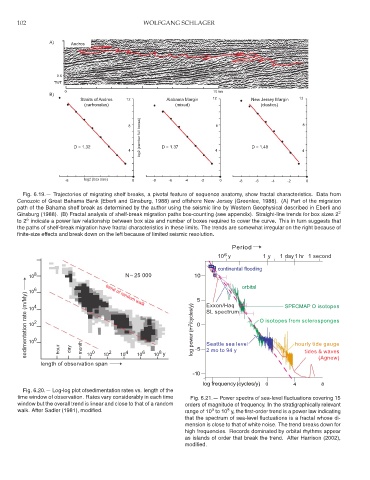
        Fig. 6.19.— Trajectories of migrating shelf breaks, a pivotal feature of sequence anatomy, show fractal characteristics. Data from
       Cenozoic of Great Bahama Bank (Eberli and Ginsburg, 1988) and offshore New Jersey (Greenlee, 1988). (A) Part of the migration
       path of the Bahama shelf break as determined by the author using the seismic line by Western Geophysical described in Eberli and
       Ginsburg (1988). (B) Fractal analysis of shelf-break migration paths box-counting (see appendix). Straight-line trends for box sizes 2 2
          6
       to 2 indicate a power law relationship between box size and number of boxes required to cover the curve. This in turn suggests that
       the paths of shelf-break migration have fractal characteristics in these limits. The trends are somewhat irregular on the right because of
       finite-size effects and break down on the left because of limited seismic resolution.
                                                                              Period
                                                                           6
                                                                         10 y           1 y   1 day 1 hr  1 second
                                                                         continental flooding
            8
           10                             N   25 000             10
                                                                                 orbital
            6
           10 4                     trend of random walk          5  Exxon/Haq                 SPECMAP O isotopes
          sedimentation rate (m/My)  10 2                        log power (m 2 /cycles/y)  0  SL spectrum  O isotopes from sclerosponges


           10


            0
           10
                            month
                                                                                                   hourly tide gauge
                                                                     Seattle sea level
                     hour
                        day
                                                      8
                               0
                              10
                                   10
                                                                                                          (Agnew)
              length of observation span  2  10 4  10 6  10 y     -5  2 mo to 94 y                    tides & waves
                                                                 -10
                                                                    log frequency (cycles/y)  0   4        8
         Fig. 6.20.— Log-log plot ofsedimentation rates vs. length of the
       time window of observation. Rates vary considerably in each time  Fig. 6.21.— Power spectra of sea-level fluctuations covering 15
       window but the overall trend is linear and close to that of a random  orders of magnitude of frequency. In the stratigraphically relevant
                                                                            8
       walk. After Sadler (1981), modified.                    range of 10 to 10 y, the first-order trend is a power law indicating
                                                                       0
                                                              that the spectrum of sea-level fluctuations is a fractal whose di-
                                                              mension is close to that of white noise. The trend breaks down for
                                                              high frequencies. Records dominated by orbital rhythms appear
                                                              as islands of order that break the trend. After Harrison (2002),
                                                              modified.
   106   107   108   109   110   111   112   113   114   115   116