Page 112 - Carbonate Sedimentology and Sequence Stratigraphy
P. 112

CHAPTER 6: FUNDAMENTALS OF SEQUENCE STRATIGRAPHY                                 103


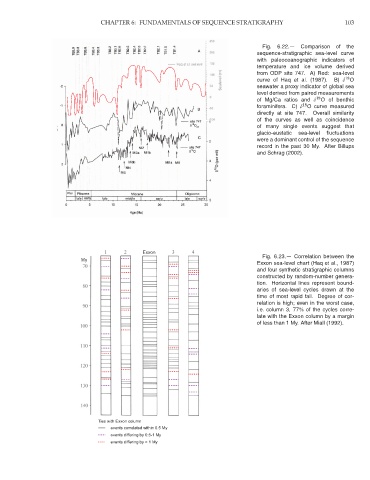
                                                                                        Fig.  6.22.—  Comparison  of  the
                                                                                      sequence-stratigraphic sea-level curve
                                                                                      with paleoceanographic indicators of
                                                                                      temperature and ice volume derived
                                                                                      from ODP site 747. A) Red: sea-level
                                                                                                                   18
                                                                                      curve of Haq et al. (1987).  B) δ O
                                                                                      seawater a proxy indicator of global sea
                                                                                      level derived from paired measurements
                                                                                                          18
                                                                                      of Mg/Ca ratios and δ O of benthic
                                                                                                     18
                                                                                      foraminifera. C) δ O curve measured
                                                                                      directly at site 747.  Overall similarity
                                                                                      of the curves as well as coincidence
                                                                                      of many single events suggest that
                                                                                      glacio-eustatic  sea-level  fluctuations
                                                                                      were a dominant control of the sequence
                                                                                      record in the past 30 My. After Billups
                                                                                      and Schrag (2002).


                                                Exxon
                                                                                        Fig. 6.23.— Correlation between the
                            My
                                                                                      Exxon sea-level chart (Haq et al., 1987)
                                                                                      and four synthetic stratigraphic columns
                                                                                      constructed by random-number genera-
                                                                                      tion. Horizontal lines represent bound-
                                                                                      aries of sea-level cycles drawn at the
                                                                                      time of most rapid fall. Degree of cor-
                                                                                      relation is high; even in the worst case,
                                                                                      i.e. column 3, 77% of the cycles corre-
                                                                                      late with the Exxon column by a margin
                                                                                      of less than 1 My. After Miall (1992).


                                  Ties with Exxon column
                                      events correlated within 0.5 My
                                      events differing by 0.5-1 My
                                      events differing by > 1 My
   107   108   109   110   111   112   113   114   115   116   117