
Page 126 - Carbonate Sedimentology and Sequence Stratigraphy
P. 126
CHAPTER 7: SEQUENCE STRATIGRAPHY OF THE T FACTORY 117
peri-platform mud carbonate 60 Bahamas
Bahamas ooze slope
30 Igl Gl 40
20
Glacial 0
N=22 N=20
20
120
100 Bahamas
Interglacial 80 basin
10
60
40
0 20
terrigenous mud 0
N Atlantic 60
Pedro Bank
20 Interglacial N=56 40
Maldives
20
0
frequency % 40
Glacial
20
0
0 50 100 150 200 250 100
sedimentation rates in mm/ky Queensland plateau
80
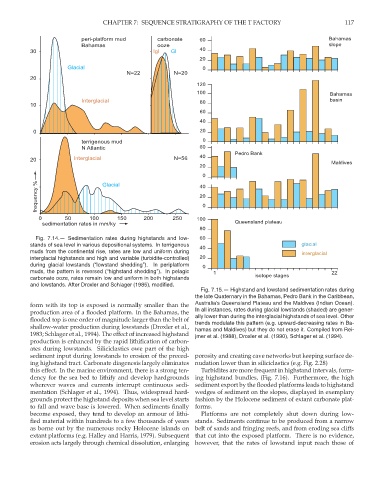
Fig. 7.14.— Sedimentation rates during highstands and low- 60
stands of sea level in various depositional systems. In terrigenous glacial
40
muds from the continental rise, rates are low and uniform during interglacial
interglacial highstands and high and variable (turbidite-controlled) 20
during glacial lowstands (“lowstand shedding”). In periplatform 0
muds, the pattern is reversed (“highstand shedding”). In pelagic 1 22
carbonate ooze, rates remain low and uniform in both highstands isotope stages
and lowstands. After Droxler and Schlager (1985), modified.
Fig. 7.15.— Highstand and lowstand sedimentation rates during
the late Quaternary in the Bahamas, Pedro Bank in the Caribbean,
form with its top is exposed is normally smaller than the Australia’s Queensland Plateau and the Maldives (Indian Ocean).
production area of a flooded platform. In the Bahamas, the In all instances, rates during glacial lowstands (shaded) are gener-
flooded top is one order of magnitude larger than the belt of ally lower than during the interglacial highstands of sea level. Other
trends modulate this pattern (e.g. upward-decreasing rates in Ba-
shallow-water production during lowstands (Droxler et al.,
hamas and Maldives) but they do not erase it. Compiled from Rei-
1983; Schlager et al., 1994). The effect of increased highstand
jmer et al. (1988), Droxler et al. (1990), Schlager et al. (1994).
production is enhanced by the rapid lithification of carbon-
ates during lowstands. Siliciclastics owe part of the high
sediment input during lowstands to erosion of the preced- porosity and creating cave networks but keeping surface de-
ing highstand tract. Carbonate diagenesis largely eliminates nudation lower than in siliciclastics (e.g. Fig. 2.28)
this effect. In the marine environment, there is a strong ten- Turbidites are more frequent in highstand intervals, form-
dency for the sea bed to lithify and develop hardgrounds ing highstand bundles, (Fig. 7.16). Furthermore, the high
wherever waves and currents interrupt continuous sedi- sediment export by the flooded platforms leads to highstand
mentation (Schlager et al., 1994). Thus, widespread hard- wedges of sediment on the slopes, displayed in exemplary
grounds protect the highstand deposits when sea level starts fashion by the Holocene sediment of extant carbonate plat-
to fall and wave base is lowered. When sediments finally forms.
become exposed, they tend to develop an armour of lithi- Platforms are not completely shut down during low-
fied material within hundreds to a few thousands of years stands. Sediments continue to be produced from a narrow
as borne out by the numerous rocky Holocene islands on belt of sands and fringing reefs, and from eroding sea cliffs
extant platforms (e.g. Halley and Harris, 1979). Subsequent that cut into the exposed platform. There is no evidence,
erosion acts largely through chemical dissolution, enlarging however, that the rates of lowstand input reach those of