
Page 134 - Carbonate Sedimentology and Sequence Stratigraphy
P. 134
CHAPTER 7: SEQUENCE STRATIGRAPHY OF THE T FACTORY 125
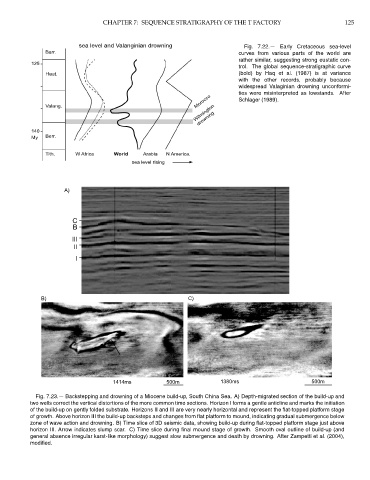
sea level and Valanginian drowning Fig. 7.22.— Early Cretaceous sea-level
Barr. curves from various parts of the world are
rather similar, suggesting strong eustatic con-
125
trol. The global sequence-stratigraphic curve
Haut. (bold) by Haq et al. (1987) is at variance
with the other records, probably because
widespread Valaginian drowning unconformi-
ties were misinterpreted as lowstands. After
Morocco Schlager (1989).
Wilmington
Valang.
drowning
140
My Berr.
Tith. W Africa World Arabia N America.
sea level rising
A)
C
B
III
II
I
B) C)
1414ms 500m 1380ms 500m
Fig. 7.23.— Backstepping and drowning of a Miocene build-up, South China Sea. A) Depth-migrated section of the build-up and
two wells correct the vertical distortions of the more common time sections. Horizon I forms a gentle anticline and marks the initiation
of the build-up on gently folded substrate. Horizons II and III are very nearly horizontal and represent the flat-topped platform stage
of growth. Above horizon III the build-up backsteps and changes from flat platform to mound, indicating gradual submergence below
zone of wave action and drowning. B) Time slice of 3D seismic data, showing build-up during flat-topped platform stage just above
horizon III. Arrow indicates slump scar. C) Time slice during final mound stage of growth. Smooth oval outline of build-up (and
general absence irregular karst-like morphology) suggest slow submergence and death by drowning. After Zampetti et al. (2004),
modified.