
Page 28 - Carbonate Sedimentology and Sequence Stratigraphy
P. 28
CHAPTER 2: PRINCIPLES OF CARBONATE PRODUCTION 19
Hawaii Maui Darwin
reef accretion (kg CaCO /m²/y) 15 Oahu Nihoa FFS Laysan Maro P & H Midway
Point
10
5
23
19 20 21 21 Necker 24 Gardner 25 Lisianski 26 27 28 Kure 29
latitude (° N)
massive coral-algal reef complexes reef complexes mixed bedded bryozoan-
with bryozoan-algal algal bioclastic debris;
biostromes reef growth during
climatic optima only
0° 10° 20° 30° 40°
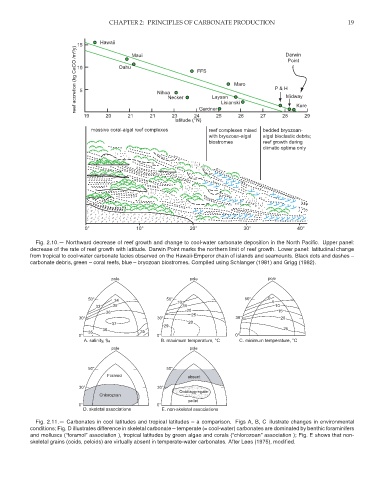
Fig. 2.10.— Northward decrease of reef growth and change to cool-water carbonate deposition in the North Pacific. Upper panel:
decrease of the rate of reef growth with latitude. Darwin Point marks the northern limit of reef growth. Lower panel: latitudinal change
from tropical to cool-water carbonate facies observed on the Hawaii-Emperor chain of islands and seamounts. Black dots and dashes –
carbonate debris, green – coral reefs, blue – bryozoan biostromes. Compiled using Schlanger (1981) and Grigg (1982).
pole pole pole
50° 34 50° 10 50° 0 5
33 35 15 10
20 15
36
25
30° 30° 30° 20
37 28
29
36 25
35 35
0° 0° 0°
pole pole
50° 50°
Foramol absent
30° 30°
Ooid/aggregate
Chlorozoan
pellet
0° 0°
Fig. 2.11.— Carbonates in cool latitudes and tropical latitudes – a comparison. Figs A, B, C illustrate changes in environmental
conditions; Fig. D illustrates difference in skeletal carbonate – temperate (= cool-water) carbonates are dominated by benthic foraminifers
and molluscs (“foramol” association ), tropical latitudes by green algae and corals (“chlorozoan” association ); Fig. E shows that non-
skeletal grains (ooids, peloids) are virtually absent in temperate-water carbonates. After Lees (1975), modified.