
Page 24 - Carbonate Sedimentology and Sequence Stratigraphy
P. 24
CHAPTER 2: PRINCIPLES OF CARBONATE PRODUCTION 15
tween photosynthesis and carbonate chemistry. Photosyn-
production in % of maximum
0 50 100 thesis extracts CO 2 from the sea water, thus increasing its
carbonate saturation and facilitating precipitation of carbon-
ate minerals. For the organisms themselves, precipitation of
mean low water
0 CaCO 3 has the added advantage that potentially deleterious
Ca 2+ ions can be removed from the system and a protective
skeleton can be constructed.
approximate depth in meters zone of light saturation thesis and light explains the decrease of skeletal carbon-
The link between skeletal carbonate fixation, photosyn-
ate production with water depth in tropical environments.
Above sea level, carbonate production rapidly drops to zero
in the supratidal zone and becomes negative in most terres-
trial environments as carbonate material dissolves in rain
The typical pattern is shown in
water and acidic soils.
Fig. 2.3 and Fig. 2.4 whereas Figs. 2.5 and 2.6 show spe-
100 approximate base of photic zone
in clear ocean waters
Fig. 2.3.— The profile of carbonate production (red) in a tropical
setting from terrestrial elevation to subphotic depth. In most ter-
restrial environments, production is negative as carbonate rocks
are being dissolved by rainwater and acidic soils. Maximum pro-
duction is in the upper part of the photic zone (zone of light sat- 10.0
uration), from where it decreases approximatly exponentially with
depth.
carbonate production (P), light intensity (I)
20.0
I c I k P max I o
light I z =I 0 e -kz depth (m)
water depth (d) carbonate production P z =P max tanh(I z /I k ) 30.0
base light saturation
base euphotic zone
40.0
Fig. 2.4.— Change of light intensity and tropical carbonate
production with water depth. Light displays a simple exponen-
tial decrease with water depth (black curve and equation). The
production of organic matter can be related via a hyperbolic-
tangent function to light intensity (red curve and equation). Pro-
duction shows a shallow zone of light saturation, where light is
not a growth-limiting factor, followed by rapid decrease of organic 5.0 10.0
growth with water depth (definitions in Fig. 1.15). In the tropi- growth rate (mm/yr)
cal carbonate factory, organic production can be taken as a good
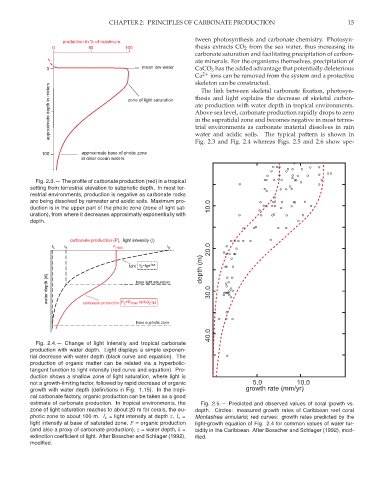
estimate of carbonate production. In tropical environments, the Fig. 2.5.— Predicted and observed values of coral growth vs.
zone of light saturation reaches to about 20 m for corals, the eu- depth. Circles: measured growth rates of Caribbean reef coral
photic zone to about 100 m. I z = light intensity at depth z, I s = Montastrea annularis; red curves: growth rates predicted by the
light intensity at base of saturated zone, P = organic production light-growth equation of Fig. 2.4 for common values of water tur-
(and also a proxy of carbonate production), z = water depth, k = bidity in the Caribbean. After Bosscher and Schlager (1992), mod-
extinction coefficient of light. After Bosscher and Schlager (1992), ified.
modified.