
Page 19 - Carbonate Sedimentology and Sequence Stratigraphy
P. 19
10 WOLFGANG SCHLAGER
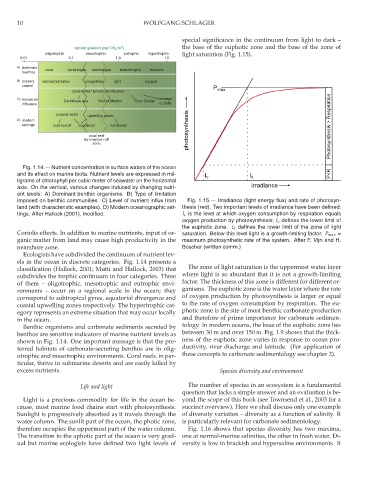
special significance in the continuum from light to dark –
nutrient gradient (mg Chl α /m 3 ) the base of the euphotic zone and the base of the zone of
oligotrophic mesotrophic eutrophic hypertrophic light saturation (Fig. 1.15).
0.01 0.1 1.0 10
A) dominant coral coral-algae macroalgae heterotrophs bacteria
benthos
B) primary nutrient limitation competition light oxygen
control
P max
continental / terrestrial influence
C) terrestrial Caribbean sea Gulf of Mexico River Deltas sewage
influence outfalls
oceanic reefs upwelling zones
D) modern
settings subtropical equatorial meridional photosynthesis Photosynthesis > Respiration
coral reef
turn-on/turn off
zone
Fig. 1.14.— Nutrient concentration in surface waters of the ocean
and its effect on marine biota. Nutrient levels are expressed in mil- P<R
I c I k
ligrams of chlorophyll per cubic meter of seawater on the horizontal
axis. On the vertical, various changes induced by changing nutri- irradiance
ent levels: A) Dominant benthic organisms. B) Type of limitation
imposed on benthic communities. C) Level of nutrient influx from Fig. 1.15.— Irradiance (light energy flux) and rate of photosyn-
land (with characteristic examples). D) Modern oceanographic set- thesis (red). Two important levels of irradiance have been defined:
tings. After Hallock (2001), modified. I c is the level at which oxygen consumption by respiration equals
oxygen production by photosynthesis; I c defines the lower limit of
the euphotic zone. I k defines the lower limit of the zone of light
Coriolis effects. In addition to marine nutrients, input of or- saturation. Below this level light is a growth-limiting factor. P max =
ganic matter from land may cause high productivity in the maximum photosynthetic rate of the system. After F. Vijn and H.
nearshore zone. Boscher (written comm.)
Ecologists have subdivided the continuum of nutrient lev-
els in the ocean in discrete categories. Fig. 1.14 presents a
classification (Hallock, 2001; Mutti and Hallock, 2003) that The zone of light saturation is the uppermost water layer
subdivides the trophic continuum in four categories. Three where light is so abundant that it is not a growth-limiting
of them – oligotrophic, mesotrophic and eutrophic envi- factor. The thickness of this zone is different for different or-
ronments – occur on a regional scale in the ocean; they ganisms. The euphotic zone is the water layer where the rate
correspond to subtropical gyres, equatorial divergence and of oxygen production by photosynthesis is larger or equal
coastal upwelling zones respectively. The hypertrophic cat- to the rate of oxygen consumption by respiration. The eu-
egory represents an extreme situation that may occur locally photic zone is the site of most benthic carbonate production
in the ocean. and therefore of prime importance for carbonate sedimen-
Benthic organisms and carbonate sediments secreted by tology. In modern oceans, the base of the euphotic zone lies
benthos are sensitive indicators of marine nutrient levels as between 30 m and over 150 m. Fig. 1.9 shows that the thick-
shown in Fig. 1.14. One important message is that the pre- ness of the euphotic zone varies in response to ocean pro-
ferred habitats of carbonate-secreting benthos are in olig- ductivity, river discharge and latitude. (For application of
otrophic and mesotrophic environments. Coral reefs, in par- these concepts to carbonate sedimentology see chapter 2).
ticular, thrive in submarine deserts and are easily killed by
excess nutrients. Species diversity and environment
Life and light The number of species in an ecosystem is a fundamental
question that lacks a simple answer and an evaluation is be-
Light is a precious commodity for life in the ocean be- yond the scope of this book (see Townsend et al., 2003 for a
cause, most marine food chains start with photosynthesis. succinct overview). Here we shall discuss only one example
Sunlight is progressively absorbed as it travels through the of diversity variation – diversity as a function of salinity. It
water column. The sunlit part of the ocean, the photic zone, is particularly relevant for carbonate sedimentology.
therefore occupies the uppermost part of the water column. Fig. 1.16 shows that species diversity has two maxima,
The transition to the aphotic part of the ocean is very grad- one at normal-marine salinities, the other in fresh water. Di-
ual but marine ecologists have defined two light levels of versity is low in brackish and hypersaline environments. It