
Page 26 - Centrifugal Pumps 2E
P. 26
14 Centrifugal Pumps: Design and Application
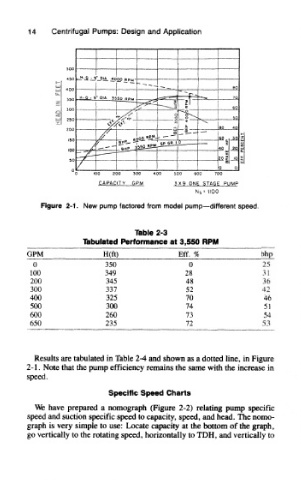
Figure 2-1. New pump factored from model pump—different speed.
Table 2-3
Tabulated Performance at 3,550 RPM
GPM H(ft) Eff. % bhp
0 350 0 25
100 349 28 31
200 345 48 36
300 337 52 42
400 325 70 46
500 300 74 51
600 260 73 54
650 235 72 53
Results are tabulated in Table 2-4 and shown as a dotted line, in Figure
2-1. Note that the pump efficiency remains the same with the increase in
speed.
Specific Speed Charts
We have prepared a nomograph (Figure 2-2) relating pump specific
speed and suction specific speed to capacity, speed, and head. The nomo-
graph is very simple to use: Locate capacity at the bottom of the graph,
go vertically to the rotating speed, horizontally to TDH, and vertically to