
Page 64 - Centrifugal Pumps Design and Application
P. 64
General Pump Design 4?
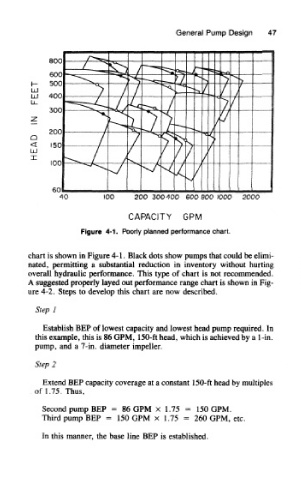
Figure 4-1. Poorly planned performance chart.
chart is shown in Figure 4-1. Black dots show pumps that could be elimi-
nated, permitting a substantial reduction in inventory without hurting
overall hydraulic performance. This type of chart is not recommended.
A suggested properly layed out performance range chart is shown in Fig-
ure 4-2. Steps to develop this chart are now described.
Step 1
Establish BEP of lowest capacity and lowest head pump required. In
this example, this is 86 GPM, 150-ft head, which is achieved by a l~in.
pump, and a 7-in. diameter impeller.
Step 2
Extend BEP capacity coverage at a constant 150-ft head by multiples
.of 1.75. Thus,
Second pump BEP = 86 GPM x 1.75 = 150 GPM.
Third pump BEP = 150 GPM x 1.75 = 260 GPM, etc.
In this manner, the base line BEP is established.