
Page 127 - Challenges in Corrosion Costs Causes Consequences and Control(2015)
P. 127
DATA COLLECTION AND ECONOMIC ANALYSIS 105
Sector 5.03 – Industrial chemicals Sector 5.03 – Industrial chemicals
total direct cost ($690 million) avoidable cost ($90 million)
Life 29 – 35
{
capital = 2%
Replacement Inputs
capital Δ M&R
Δ capital = 2%
Growth
capital
Value Inputs
added 20% Inhibitors Capital
{
25%Δ tech, service 80% M&R Life 29 – 35
75%Δ capital
Sector 19.03 – Public utility construction Sector 19.03 – Public utility construction
total direct cost ($2000 million) avoidable cost ($315 million)
Life 7.5 – 12
Capital, Inputs
replacement Δ M&R
and growth Inputs
20% Metal shift
6% Cathodic protection Capital
3% M&R Life 7.5 – 12
1% Coatings
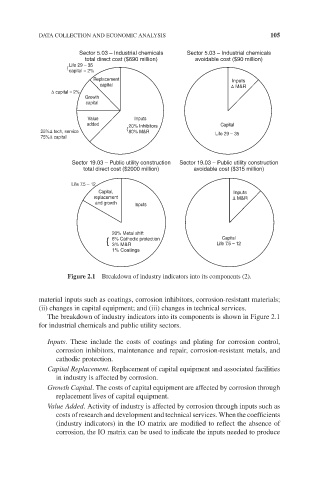
Figure 2.1 Breakdown of industry indicators into its components (2).
material inputs such as coatings, corrosion inhibitors, corrosion-resistant materials;
(ii) changes in capital equipment; and (iii) changes in technical services.
The breakdown of industry indicators into its components is shown in Figure 2.1
for industrial chemicals and public utility sectors.
Inputs. These include the costs of coatings and plating for corrosion control,
corrosion inhibitors, maintenance and repair, corrosion-resistant metals, and
cathodic protection.
Capital Replacement. Replacement of capital equipment and associated facilities
in industry is affected by corrosion.
Growth Capital. The costs of capital equipment are affected by corrosion through
replacement lives of capital equipment.
Value Added. Activity of industry is affected by corrosion through inputs such as
costs of research and development and technical services. When the coefficients
(industry indicators) in the IO matrix are modified to reflect the absence of
corrosion, the IO matrix can be used to indicate the inputs needed to produce