
Page 216 - Challenges in Corrosion Costs Causes Consequences and Control(2015)
P. 216
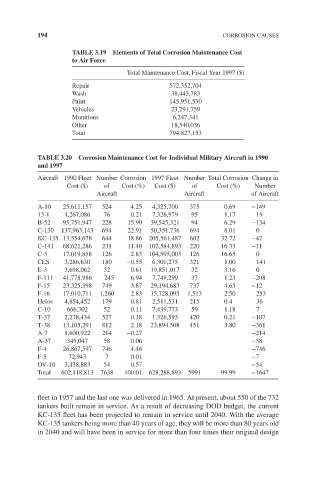
194                                                 CORROSION CAUSES

                     TABLE 3.19  Elements of Total Corrosion Maintenance Cost
                     to Air Force
                                    Total Maintenance Cost, Fiscal Year 1997 ($)
                     Repair                     572,352,704
                     Wash                        38,443,783
                     Paint                      145,951,530
                     Vehicles                    23,291,759
                     Munitions                   6,247,341
                     Other                       18,540,036
                     Total                      794,827,153


           TABLE 3.20  Corrosion Maintenance Cost for Individual Military Aircraft in 1990
           and 1997
           Aircraft 1990 Fleet Number Corrosion 1997 Fleet Number Total Corrosion Change in
                    Cost ($)  of   Cost (%)  Cost ($)  of    Cost (%)   Number
                            Aircraft                Aircraft           of Aircraft
           A-10   25,611,157  524    4.25  4,325,700  375      0.69    −149
           13-1    1,267,086  76     0.21  7,326,979  95       1.17     19
           B-52   95,751,947  228   15.90  39,545,321  94      6.29    −134
           C-130  137,963,143  694  22.91  50,351,736  694     8.01     0
           KC-135 13,554,678  644   18.86  205,561,487  602   32.72    −42
           C-141  68,621,286  231   11.40  102,584,893  220   16.33    −11
           C-5    17,019,858  126    2.83  104,595,003  126   16.65     0
           CLS     3,286,630  180   −0.55  6,301,275  321      1.00     141
           E-3     3,698,062  32     0.61  19,851,017  32      3.16     0
           F-111  41,778,986  245    6.94  7,749,299  37       1.23    −208
           F-15   23,325,398  749    3.87  29,194,683  737     4.65    −12
           F-16   17,010,711  1,260  2.83  15,728,095  1,513   2.50     253
           Helos   4,854,452  179    0.81  2,511,531  215      0.4      36
           C-10     666,302   52     0.11  7,439,773  59       1.18     7
           T-37    2,278,434  527    0.38  1,326,593  420      0.21    −107
           T-38   13,105,291  812    2.18  23,894.508  451     3.80    −361
           A-7     1,600,922  214   −0.27                              −214
           A-37     345,047   58     0.06                              −58
           F-4    26,867,597  746    4.46                              −746
           F-5      72,943    7      0.01                              −7
           OV-10   3,438,883  54     0.57                              −54
           Total  602,118,813  7638  100.01  628,288,893  5991  99.99  −1647


           fleet in 1957 and the last one was delivered in 1965. At present, about 550 of the 732
           tankers built remain in service. As a result of decreasing DOD budget, the current
           KC-135 fleet has been projected to remain in service until 2040. With the average
           KC-135 tankers being more than 40 years of age, they will be more than 80 years old
           in 2040 and will have been in service for more than four times their original design