
Page 411 - Challenges in Corrosion Costs Causes Consequences and Control(2015)
P. 411
AGE-RELIABILITY CHARACTERISTICS 389
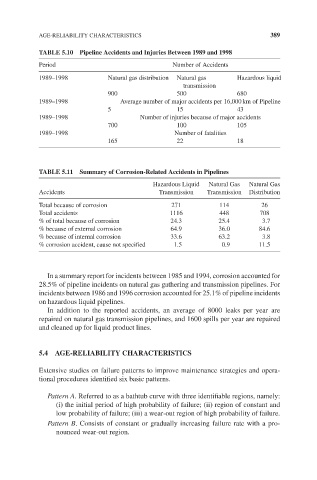
TABLE 5.10 Pipeline Accidents and Injuries Between 1989 and 1998
Period Number of Accidents
1989–1998 Natural gas distribution Natural gas Hazardous liquid
transmission
900 500 680
1989–1998 Average number of major accidents per 16,000 km of Pipeline
5 15 43
1989–1998 Number of injuries because of major accidents
700 100 105
1989–1998 Number of fatalities
165 22 18
TABLE 5.11 Summary of Corrosion-Related Accidents in Pipelines
Hazardous Liquid Natural Gas Natural Gas
Accidents Transmission Transmission Distribution
Total because of corrosion 271 114 26
Total accidents 1116 448 708
% of total because of corrosion 24.3 25.4 3.7
% because of external corrosion 64.9 36.0 84.6
% because of internal corrosion 33.6 63.2 3.8
% corrosion accident, cause not specified 1.5 0.9 11.5
In a summary report for incidents between 1985 and 1994, corrosion accounted for
28.5% of pipeline incidents on natural gas gathering and transmission pipelines. For
incidents between 1986 and 1996 corrosion accounted for 25.1% of pipeline incidents
on hazardous liquid pipelines.
In addition to the reported accidents, an average of 8000 leaks per year are
repaired on natural gas transmission pipelines, and 1600 spills per year are repaired
and cleaned up for liquid product lines.
5.4 AGE-RELIABILITY CHARACTERISTICS
Extensive studies on failure patterns to improve maintenance strategies and opera-
tional procedures identified six basic patterns.
Pattern A. Referred to as a bathtub curve with three identifiable regions, namely:
(i) the initial period of high probability of failure; (ii) region of constant and
low probability of failure; (iii) a wear-out region of high probability of failure.
Pattern B. Consists of constant or gradually increasing failure rate with a pro-
nounced wear-out region.