
Page 95 - Challenges in Corrosion Costs Causes Consequences and Control(2015)
P. 95
ENVIRONMENTALLY INDUCED CRACKING (EIC) 73
values, which plays an important role in SCC-hydrogen-induced subcritical crack
growth mechanisms.
The E–pH diagram of the cracking metal/solution interface is a useful tool in the
evaluation and understanding of the mechanism of SCC although it is difficult to
evaluate in a precise manner. The E–pH behavior of the crack tip solution interface
is substantially different from that in bulk solution (97–99).
1.8.9 Active–Passive Behavior and Susceptible Zone of Potentials
An example of the behavior is shown by stainless steel in 1.0 M sulfuric acid solu-
tion. Transgranular SCC can occur in two ranges of potentials. Intergranular SCC
can occur in a wider potential range. The potential zones 1 and 2 correspond to
the active–passive and passive–active state transitions. The crack tip corresponds to
the crack tip and the passive state, or film formation corresponds to zone 2. Zone
2 is frequently above the pitting potential, indicating the possible pit initiation and
propagation.
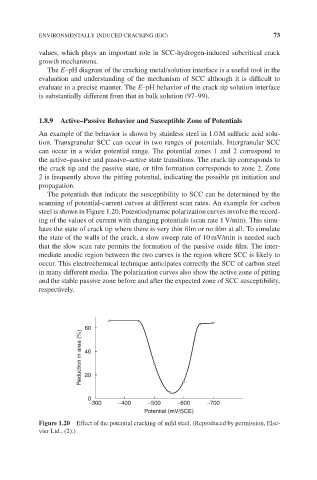
The potentials that indicate the susceptibility to SCC can be determined by the
scanning of potential-current curves at different scan rates. An example for carbon
steel is shown in Figure 1.20. Potentiodynamic polarization curves involve the record-
ing of the values of current with changing potentials (scan rate 1 V/min). This simu-
lates the state of crack tip where there is very thin film or no film at all. To simulate
the state of the walls of the crack, a slow sweep rate of 10 mV/min is needed such
that the slow scan rate permits the formation of the passive oxide film. The inter-
mediate anodic region between the two curves is the region where SCC is likely to
occur. This electrochemical technique anticipates correctly the SCC of carbon steel
in many different media. The polarization curves also show the active zone of pitting
and the stable passive zone before and after the expected zone of SCC susceptibility,
respectively.
Reduction in area (%) 60
40
20
0
–300 –400 –500 –600 –700
Potential (mV/SCE)
Figure 1.20 Effect of the potential cracking of mild steel. (Reproduced by permission, Else-
vier Ltd., (2).)