
Page 302 - Chemical engineering design
P. 302
COSTING AND PROJECT EVALUATION
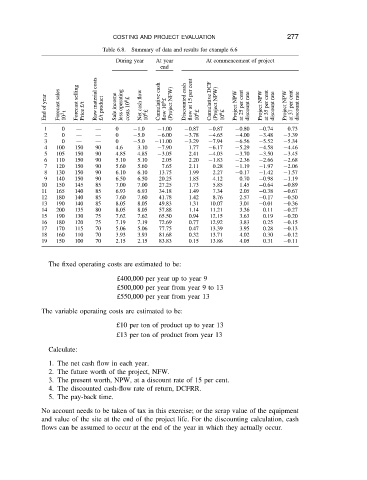
Summary of data and results for example 6.6
Table 6.8.
During year At year At commencement of project 277
end
End of year Forecast sales 10 3 t Forecast selling Price £/t Raw material costs £/t product Sale income less operating costs 10 6 £ Net cash flow 10 6 £ Cumulative cash flow 10 6 £ (Project NFW) Discounted cash flow at 15 per cent 10 6 £ Cumulative DCF (Project NPW) 10 6 £ Project NPW at 25 per cent discount rate Project NPW at 35 per cent discount rate Project NPW at 37 p
1 0 0 1.0 1.00 0.87 0.87 0.80 0.74 0.73
2 0 0 5.0 6.00 3.78 4.65 4.00 3.48 3.39
3 0 0 5.0 11.00 3.29 7.94 6.56 5.52 5.34
4 100 150 90 4.6 3.10 7.90 1.77 6.17 5.29 4.58 4.46
5 105 150 90 4.85 4.85 3.05 2.41 4.03 3.70 3.50 3.45
6 110 150 90 5.10 5.10 2.05 2.20 1.83 2.36 2.66 2.68
7 120 150 90 5.60 5.60 7.65 2.11 0.28 1.19 1.97 2.06
8 130 150 90 6.10 6.10 13.75 1.99 2.27 0.17 1.42 1.57
9 140 150 90 6.50 6.50 20.25 1.85 4.12 0.70 0.98 1.19
10 150 145 85 7.00 7.00 27.25 1.73 5.85 1.45 0.64 0.89
11 165 140 85 6.93 6.93 34.18 1.49 7.34 2.05 0.38 0.67
12 180 140 85 7.60 7.60 41.78 1.42 8.76 2.57 0.17 0.50
13 190 140 85 8.05 8.05 49.83 1.31 10.07 3.01 0.01 0.36
14 200 135 80 8.05 8.05 57.88 1.14 11.21 3.36 0.11 0.27
15 190 130 75 7.62 7.62 65.50 0.94 12.15 3.63 0.19 0.20
16 180 120 75 7.19 7.19 72.69 0.77 12.92 3.83 0.25 0.15
17 170 115 70 5.06 5.06 77.75 0.47 13.39 3.95 0.28 0.13
18 160 110 70 3.93 3.93 81.68 0.32 13.71 4.02 0.30 0.12
19 150 100 70 2.15 2.15 83.83 0.15 13.86 4.05 0.31 0.11
The fixed operating costs are estimated to be:
£400,000 per year up to year 9
£500,000 per year from year 9 to 13
£550,000 per year from year 13
The variable operating costs are estimated to be:
£10 per ton of product up to year 13
£13 per ton of product from year 13
Calculate:
1. The net cash flow in each year.
2. The future worth of the project, NFW.
3. The present worth, NPW, at a discount rate of 15 per cent.
4. The discounted cash-flow rate of return, DCFRR.
5. The pay-back time.
No account needs to be taken of tax in this exercise; or the scrap value of the equipment
and value of the site at the end of the project life. For the discounting calculation, cash
flows can be assumed to occur at the end of the year in which they actually occur.