
Page 231 - Classification Parameter Estimation & State Estimation An Engg Approach Using MATLAB
P. 231
220 UNSUPERVISED LEARNING
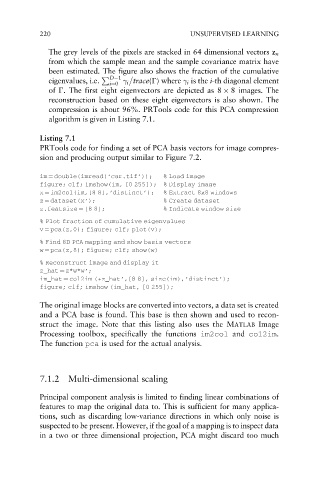
The grey levels of the pixels are stacked in 64 dimensional vectors z n
from which the sample mean and the sample covariance matrix have
been estimated. The figure also shows the fraction of the cumulative
eigenvalues, i.e. P D 1
i trace( )where
i is the i-th diagonal element
i¼0
of . The first eight eigenvectors are depicted as 8 8 images. The
reconstruction based on these eight eigenvectors is also shown. The
compression is about 96%. PRTools code for this PCA compression
algorithm is given in Listing 7.1.
Listing 7.1
PRTools code for finding a set of PCA basis vectors for image compres-
sion and producing output similar to Figure 7.2.
im ¼ double(imread(‘car.tif’)); % Load image
figure; clf; imshow(im, [0 255]); % Display image
x ¼ im2col(im,[8 8],‘distinct’); % Extract 8x8 windows
z ¼ dataset(x’); % Create dataset
z.featsize ¼ [8 8]; % Indicate window size
% Plot fraction of cumulative eigenvalues
v ¼ pca(z,0); figure; clf; plot(v);
% Find 8D PCA mapping and show basis vectors
w ¼ pca(z,8); figure; clf; show(w)
% Reconstruct image and display it
z_hat ¼ z*w*w’;
im_hat ¼ col2im (+z_hat’,[8 8], size(im),‘distinct’);
figure; clf; imshow (im_hat, [0 255]);
The original image blocks are converted into vectors, a data set is created
and a PCA base is found. This base is then shown and used to recon-
struct the image. Note that this listing also uses the MATLAB Image
Processing toolbox, specifically the functions im2col and co12im.
The function pca is used for the actual analysis.
7.1.2 Multi-dimensional scaling
Principal component analysis is limited to finding linear combinations of
features to map the original data to. This is sufficient for many applica-
tions, such as discarding low-variance directions in which only noise is
suspected to be present. However, if the goal of a mapping is to inspect data
in a two or three dimensional projection, PCA might discard too much