
Page 33 - Classification Parameter Estimation & State Estimation An Engg Approach Using MATLAB
P. 33
22 DETECTION AND CLASSIFICATION
(a) (b)
1 0.8 1
measure of eccentricity 0.6 measure of eccentricity 0.6
0.8
0.4
0.4
0.2
0 0.2 0
0 0.2 0.4 0.6 0.8 1 0 0.2 0.4 0.6 0.8 1
measure of six-fold rotational symmetry measure of six-fold rotational symmetry
(c)
1
measure of eccentricity 0.6
0.8
0.4
0.2
0
0 0.2 0.4 0.6 0.8 1
measure of six-fold rotational symmetry
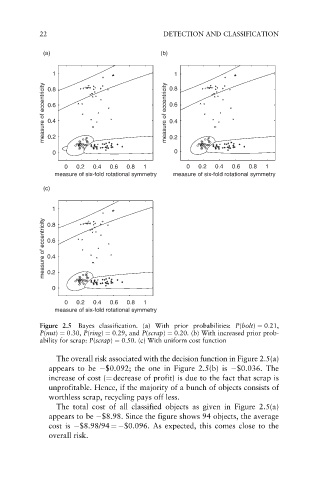
Figure 2.5 Bayes classification. (a) With prior probabilities: P(bolt) ¼ 0:21,
P(nut) ¼ 0:30, P(ring) ¼ 0:29, and P(scrap) ¼ 0:20. (b) With increased prior prob-
ability for scrap: P(scrap) ¼ 0:50. (c) With uniform cost function
The overall risk associated with the decision function in Figure 2.5(a)
appears to be $0.092; the one in Figure 2.5(b) is $0.036. The
increase of cost (¼ decrease of profit) is due to the fact that scrap is
unprofitable. Hence, if the majority of a bunch of objects consists of
worthless scrap, recycling pays off less.
The total cost of all classified objects as given in Figure 2.5(a)
appears to be $8.98. Since the figure shows 94 objects, the average
cost is $8.98/94 ¼ $0.096. As expected, this comes close to the
overall risk.