Page 291 - Communication Theory and Research
P. 291

McQuail(EJC)-3281-20.qxd  8/16/2005  12:02 PM  Page 276


                    276                                         Communication Theory & Research
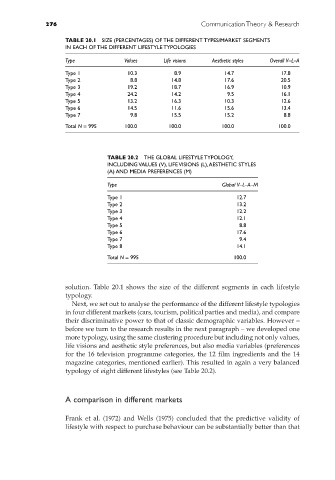
                         TABLE 20.1  SIZE (PERCENTAGES) OF THE DIFFERENT TYPES/MARKET SEGMENTS
                         IN EACH OF THE DIFFERENT LIFESTYLE TYPOLOGIES
                         Type             Values      Life visions  Aesthetic styles  Overall V–L–A
                         Type 1            10.3          8.9           14.7            17.8
                         Type 2             8.8         14.8           17.6            20.5
                         Type 3            19.2         18.7           16.9            10.9
                         Type 4            24.2         14.2            9.5            16.1
                         Type 5            13.2         16.3           10.3            12.6
                         Type 6            14.5         11.6           15.6            13.4
                         Type 7             9.8         15.5           15.2             8.8
                         Total N = 995    100.0        100.0          100.0           100.0


                                     TABLE 20.2  THE GLOBAL LIFESTYLE TYPOLOGY,
                                     INCLUDING VALUES (V), LIFE VISIONS (L),AESTHETIC STYLES
                                     (A) AND MEDIA PREFERENCES (M)
                                     Type                             Global V–L–A–M
                                     Type 1                                12.7
                                     Type 2                                13.2
                                     Type 3                                12.2
                                     Type 4                                12.1
                                     Type 5                                8.8
                                     Type 6                                17.6
                                     Type 7                                9.4
                                     Type 8                                14.1
                                     Total N = 995                        100.0


                         solution. Table 20.1 shows the size of the different segments in each lifestyle
                         typology.
                           Next, we set out to analyse the performance of the different lifestyle typologies
                         in four different markets (cars, tourism, political parties and media), and compare
                         their discriminative power to that of classic demographic variables. However –
                         before we turn to the research results in the next paragraph – we developed one
                         more typology, using the same clustering procedure but including not only values,
                         life visions and aesthetic style preferences, but also media variables (preferences
                         for the 16 television programme categories, the 12 film ingredients and the 14
                         magazine categories, mentioned earlier). This resulted in again a very balanced
                         typology of eight different lifestyles (see Table 20.2).


                         A comparison in different markets


                         Frank et al. (1972) and Wells (1975) concluded that the predictive validity of
                         lifestyle with respect to purchase behaviour can be substantially better than that
   286   287   288   289   290   291   292   293   294   295   296