
Page 294 - Communication Theory and Research
P. 294
McQuail(EJC)-3281-20.qxd 8/16/2005 12:02 PM Page 279
Lifestyle Segmentation 279
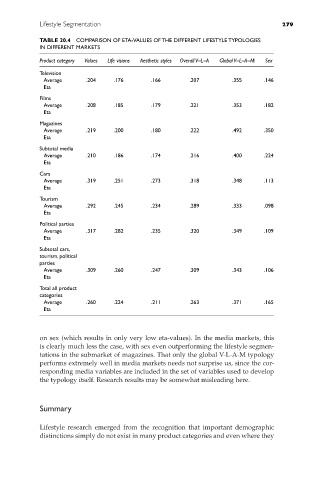
TABLE 20.4 COMPARISON OF ETA-VALUES OF THE DIFFERENT LIFESTYLE TYPOLOGIES
IN DIFFERENT MARKETS
Product category Values Life visions Aesthetic styles Overall V–L–A Global V–L–A–M Sex
Television
Average .204 .176 .166 .207 .355 .146
Eta
Films
Average .208 .185 .179 .221 .353 .182
Eta
Magazines
Average .219 .200 .180 .222 .492 .350
Eta
Subtotal media
Average .210 .186 .174 .216 .400 .224
Eta
Cars
Average .319 .251 .273 .318 .348 .113
Eta
Tourism
Average .292 .245 .234 .289 .333 .098
Eta
Political parties
Average .317 .282 .235 .320 .349 .109
Eta
Subtotal cars,
tourism, political
parties
Average .309 .260 .247 .309 .343 .106
Eta
Total all product
categories
Average .260 .224 .211 .263 .371 .165
Eta
on sex (which results in only very low eta-values). In the media markets, this
is clearly much less the case, with sex even outperforming the lifestyle segmen-
tations in the submarket of magazines. That only the global V-L-A-M typology
performs extremely well in media markets needs not surprise us, since the cor-
responding media variables are included in the set of variables used to develop
the typology itself. Research results may be somewhat misleading here.
Summary
Lifestyle research emerged from the recognition that important demographic
distinctions simply do not exist in many product categories and even where they