
Page 60 - Comparing Media Systems THREE MODELS OF MEDIA AND POLITICS
P. 60
P1: GCV/KAF/KAA P2: kaf
0521835356agg.xml Hallin 0 521 83535 6 January 20, 2004 15:9
Concepts and Models
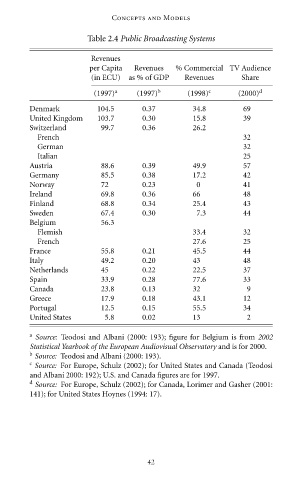
Table 2.4 Public Broadcasting Systems
Revenues
per Capita Revenues % Commercial TV Audience
(in ECU) as % of GDP Revenues Share
(1997) a (1997) b (1998) c (2000) d
Denmark 104.5 0.37 34.8 69
United Kingdom 103.7 0.30 15.8 39
Switzerland 99.7 0.36 26.2
French 32
German 32
Italian 25
Austria 88.6 0.39 49.9 57
Germany 85.5 0.38 17.2 42
Norway 72 0.23 0 41
Ireland 69.8 0.36 66 48
Finland 68.8 0.34 25.4 43
Sweden 67.4 0.30 7.3 44
Belgium 56.3
Flemish 33.4 32
French 27.6 25
France 55.8 0.21 45.5 44
Italy 49.2 0.20 43 48
Netherlands 45 0.22 22.5 37
Spain 33.9 0.28 77.6 33
Canada 23.8 0.13 32 9
Greece 17.9 0.18 43.1 12
Portugal 12.5 0.15 55.5 34
United States 5.8 0.02 13 2
a Source: Teodosi and Albani (2000: 193); figure for Belgium is from 2002
Statistical Yearbook of the European Audiovisual Observatory and is for 2000.
b Source: Teodosi and Albani (2000: 193).
c Source: For Europe, Schulz (2002); for United States and Canada (Teodosi
and Albani 2000: 192); U.S. and Canada figures are for 1997.
d
Source: For Europe, Schulz (2002); for Canada, Lorimer and Gasher (2001:
141); for United States Hoynes (1994: 17).
42