Page 151 - Comparing Political Communication Theories, Cases, and Challenge
P. 151

P1: Irk-Kic-JzL
                          0521828317agg.xml  CY425/Esser  0521828317  May 22, 2004  12:27


                                              Global Political Communication

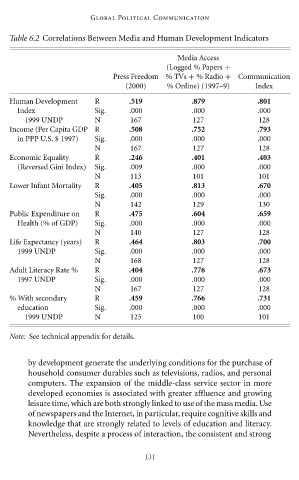
                         Table 6.2 Correlations Between Media and Human Development Indicators

                                                                    Media Access
                                                                 (Logged % Papers +
                                                   Press Freedom % TVs + %Radio + Communication
                                                       (2000)    % Online) (1997–9)     Index
                         Human Development     R        .519            .879            .801
                           Index               Sig.     .000            .000            .000
                             1999 UNDP         N        167             127              128
                         Income (Per Capita GDP R       .508            .752            .793
                           in PPP U.S. $ 1997)  Sig.    .000            .000            .000
                                               N        167             127              128
                         Economic Equality     R        .246            .401            .403
                           (Reversed Gini Index)  Sig.  .009            .000            .000
                                               N        113             101              101
                         Lower Infant Mortality  R      .405            .813            .670
                                               Sig.     .000            .000            .000
                                               N        142             129              130
                         Public Expenditure on  R       .475            .604            .659
                           Health (% of GDP)   Sig.     .000            .000            .000
                                               N        140             127              128
                         Life Expectancy (years)  R     .464            .803            .700
                           1999 UNDP           Sig.     .000            .000            .000
                                               N        168             127              128
                         Adult Literacy Rate %  R       .404            .776            .673
                           1997 UNDP           Sig.     .000            .000            .000
                                               N        167             127              128
                         %With secondary       R        .459            .766            .731
                           education           Sig.     .000            .000            .000
                             1999 UNDP         N        125             100              101

                         Note: See technical appendix for details.


                              by development generate the underlying conditions for the purchase of
                              household consumer durables such as televisions, radios, and personal
                              computers. The expansion of the middle-class service sector in more
                              developed economies is associated with greater affluence and growing
                              leisure time, which are both strongly linked to use of the mass media. Use
                              of newspapers and the Internet, in particular, require cognitive skills and
                              knowledge that are strongly related to levels of education and literacy.
                              Nevertheless, despite a process of interaction, the consistent and strong


                                                           131
   146   147   148   149   150   151   152   153   154   155   156