
Page 460 - Compression Machinery for Oil and Gas
P. 460
440 SECTION III Applications
The system then imposes a certain suction and discharge pressure on the
compressor, and the power that keeps the compressor running after the driver
is shut-off comes from the inertia of the drive train. The momentary
compressor speed is a result of the interactions (Kurz and White [16]; Moore
et al. [17]).
The system piping and vessels store a certain mass of compressible gas that
imposes a suction and discharge pressure on the compressor. The compressor
responds to these conditions with either available power, speed, or other setting
to produce a certain set flow. This flow can then change the mass stored in the
piping and vessels, thus creating a dynamic, complex system. Therefore, model-
ing to predict the behavior of the system and determine if it will react quickly
enough to avoid surge during the sudden shutdown of a compressor operating
with a full load or in a high head condition is needed to accurately size the anti-
surge valve, piping, and control system The geometry of the piping system, the
flow characteristics of the recycle and check valves, the compressor coast down
speed, the compressor performance map, and the control logic are the primary
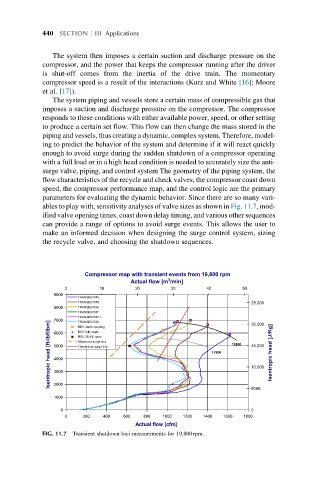
parameters for evaluating the dynamic behavior. Since there are so many vari-
ables to play with, sensitivity analyses of valve sizes as shown in Fig. 11.7, mod-
ified valve opening times, coast down delay timing, and various other sequences
can provide a range of options to avoid surge events. This allows the user to
make an informed decision when designing the surge control system, sizing
the recycle valve, and choosing the shutdown sequences.
Compressor map with transient events from 19,800 rpm
3
Actual flow [m /min]
0 10 20 30 40 50
9000
TRANSIENT#4
TRANSIENT#5
25,000
TRANSIENT#6
8000
TRANSIENT#7
TRANSIENT#7.1 20,000
Isentropic head [ft-lbf/lbm] 5000 REV 35.9% open 17800 19800 15,000 Isentropic head [J/Kg]
7000
TRANSIENT#9
REV starts opening
REV fully open
6000
Measured surge line
Theoretical surge line
4000
10,000
3000
2000
5000
1000
0 0
0 200 400 600 800 1000 1200 1400 1600 1800
Actual flow [cfm]
FIG. 11.7 Transient shutdown loci measurements for 19,800rpm.