
Page 200 - Computational Colour Science Using MATLAB
P. 200
IMPLEMENTATIONS AND EXAMPLES 187
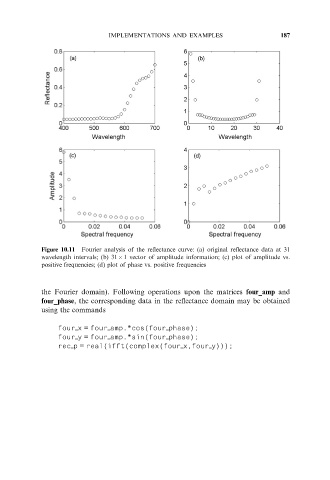
Figure 10.11 Fourier analysis of the reflectance curve: (a) original reflectance data at 31
wavelength intervals; (b) 3161 vector of amplitude information; (c) plot of amplitude vs.
positive frequencies; (d) plot of phase vs. positive frequencies
the Fourier domain). Following operations upon the matrices four_amp and
four_phase, the corresponding data in the reflectance domain may be obtained
using the commands
four___x = four___amp.*cos(four___phase);
four___y = four___amp.*sin(four___phase);
rec___p = real(ifft(complex(four___x,four___y)));