
Page 67 - Computational Colour Science Using MATLAB
P. 67
54 COMPUTING COLOUR DIFFERENCE
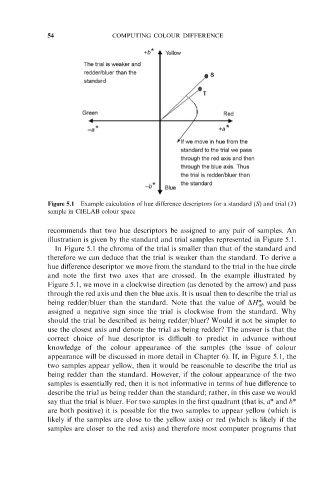
Figure 5.1 Example calculation of hue difference descriptors for a standard (S) and trial (T)
sample in CIELAB colour space
recommends that two hue descriptors be assigned to any pair of samples. An
illustration is given by the standard and trial samples represented in Figure 5.1.
In Figure 5.1 the chroma of the trial is smaller than that of the standard and
therefore we can deduce that the trial is weaker than the standard. To derive a
hue difference descriptor we move from the standard to the trial in the hue circle
and note the first two axes that are crossed. In the example illustrated by
Figure 5.1, we move in a clockwise direction (as denoted by the arrow) and pass
through the red axis and then the blue axis. It is usual then to describe the trial as
being redder/bluer than the standard. Note that the value of DH* would be
ab
assigned a negative sign since the trial is clockwise from the standard. Why
should the trial be described as being redder/bluer? Would it not be simpler to
use the closest axis and denote the trial as being redder? The answer is that the
correct choice of hue descriptor is difficult to predict in advance without
knowledge of the colour appearance of the samples (the issue of colour
appearance will be discussed in more detail in Chapter 6). If, in Figure 5.1, the
two samples appear yellow, then it would be reasonable to describe the trial as
being redder than the standard. However, if the colour appearance of the two
samples is essentially red, then it is not informative in terms of hue difference to
describe the trial as being redder than the standard; rather, in this case we would
say that the trial is bluer. For two samples in the first quadrant (that is, a* and b*
are both positive) it is possible for the two samples to appear yellow (which is
likely if the samples are close to the yellow axis) or red (which is likely if the
samples are closer to the red axis) and therefore most computer programs that