
Page 168 - Computational Retinal Image Analysis
P. 168
3 Tools and techniques 163
identified the accuracy will always be high, even if the identification of vessel pix-
els is poor. The Jaccard Coefficient (JC) offers an alternative and is expressed as
JC = TP/(TP + FP + FN). If the vessel segmentation by an algorithm matches exactly
with the ground truth then JC is one; if there is no overlap JC is 0.
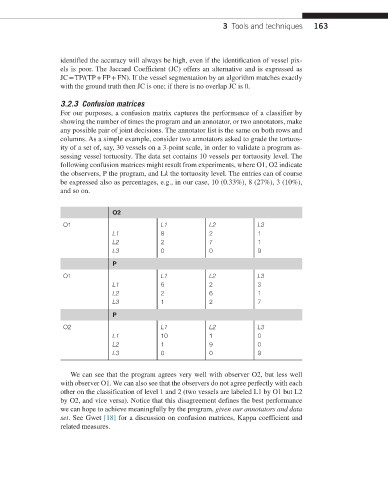
3.2.3 Confusion matrices
For our purposes, a confusion matrix captures the performance of a classifier by
showing the number of times the program and an annotator, or two annotators, make
any possible pair of joint decisions. The annotator list is the same on both rows and
columns. As a simple example, consider two annotators asked to grade the tortuos-
ity of a set of, say, 30 vessels on a 3-point scale, in order to validate a program as-
sessing vessel tortuosity. The data set contains 10 vessels per tortuosity level. The
following confusion matrices might result from experiments, where O1, O2 indicate
the observers, P the program, and Lk the tortuosity level. The entries can of course
be expressed also as percentages, e.g., in our case, 10 (0.33%), 8 (27%), 3 (10%),
and so on.
O2
O1 L1 L2 L3
L1 8 2 1
L2 2 7 1
L3 0 0 9
P
O1 L1 L2 L3
L1 6 2 3
L2 2 6 1
L3 1 2 7
P
O2 L1 L2 L3
L1 10 1 0
L2 1 9 0
L3 0 0 9
We can see that the program agrees very well with observer O2, but less well
with observer O1. We can also see that the observers do not agree perfectly with each
other on the classification of level 1 and 2 (two vessels are labeled L1 by O1 but L2
by O2, and vice versa). Notice that this disagreement defines the best performance
we can hope to achieve meaningfully by the program, given our annotators and data
set. See Gwet [18] for a discussion on confusion matrices, Kappa coefficient and
related measures.